Excel Add-in user guide
This user guide is accurate for version 1.3.934 of the Excel Add-in. Please refer to the release notes section for User Guides for other versions.
Thank you for choosing to use Fastmarkets Excel Add-in! As part of Fastmarkets platform strategy, we will provide customers with richer, more flexible mechanisms to securely access our data. This tool will allow you to pull our pricing data directly into Excel, thereby enabling you to embed our prices into your workflow.
This user guide will help you get the most out of Fastmarkets Excel Add-in to support your business needs. Please refer to the accompanying Technical Guide to install and log in for the first time to the Fastmarkets Excel Add-in.
Example templates of all of the functions included in this website and how to work with them are available on the Excel Add-In Support page for your data licence.
If after reading these instructions you have further questions about how to use Fastmarkets Excel Add-in, please contact your the Customer Success Team.
– Europe, Middle East and Africa: +44 (0)20 3855 5581
– Asia: +65 3163 3458
– Americas: +1 708 329 2641
– Customer Success Email: customersuccess@fastmarkets.com
– Client Services Email: client.services@fastmarkets.com
For more information on Fastmarkets’ products and services, please use the following links or click on the Fastmarkets Excel Add-In Ribbon buttons:
Additional Links:
Version 1.3.934 provides the following new features and functionality. For ALL customers who are below version 1.3.186 this is a mandatory upgrade which cannot be postponed. If you are upgrading from a previous version of Fastmarkets Excel Add-In you will still be able to access everything you had previously.
If you are on version 1.3.186 or above it will be possible to postpone the update.
This release includes new functionality and features to enable the option to filter out preliminary prices when exporting from the Dashboard to Excel Add-in with :
- A new function – =GetPriceHistoryNonPreliminary – similar to the
=GetPriceHistory. The difference is that the new function provides results
without preliminary prices. - A new field – MidChangeNonPreliminaryProportion – used with the above new function to reflect the correct proportion without taking into consideration preliminary prices.
- Functionality changes:
- When preliminary prices are selected to be exported from the
Dashboard to Excel Add-in the field “Preliminary price” will now be
exported by default using the =GetPriceHistory function - When hiding preliminary prices when exporting from the Dashboard to Excel Add-in a new function =GetPriceHistoryNonPreliminary will now be used (select the Copy for Excel Add-in option from the Dashboard and you have selected to hide preliminary prices in the widget)
- When preliminary prices are selected to be exported from the
Fastmarkets’ Excel Add-in enables you to easily obtain rich data around the commodities you follow. The table below summarizes the functions and pricing data available to you in this version. Please note the user of the word “symbol” in the table and through this User Guide. Each Fastmarkets price has a symbol – an alphanumeric code unique to that price.
| Function | Version | Description |
| GetInstruments( ) | v1.2.612 or above | Returns all symbols and corresponding reference data that the user is authorized to access |
| GetPriceCalculationType() | v1.2.612 or above
v1.3816 |
Returns the price calculation types for the specified symbol
New ‘WeightAverageofTrades’ Price Calculation Type introduced for Cobalt symbols MB-CO-0004 and MB-CO-0005 |
| GetAvailableCurrencyConversions() | v1.3.728 or above | Returns the available currency conversions for the specified symbol. The values returned should be used in the currency conversion parameters in the functions listed below |
| GetAvailableUnitofMeasureConversions() | v1.3.728 or above | Returns the available unit of measure conversions for the specified symbol. The values returned should be used in the unit-of-measure conversion parameter in the functions listed below |
| GetInstrumentFields( ) | v1.2.612 or above | Returns all available fields for a given symbol and Price Calculation Type |
| GetLatestPrice( ) | v1.2.612 or above
v1.3.728 |
Returns the latest price data for the specified symbol, Field and Price Calculation Type
Currency and unit of measure conversion available |
| GetPriceHistory( ) | v1.2.612 or above
v1.3.728 |
Returns price data history for the selected symbol
Currency and unit of measure conversion available |
| GetPriceHistoryNonPreliminary() | v1.3.934 or above | Returns price data history for the selected symbol without preliminary prices.
Currency and unit-of-measure conversion available. |
| GetPrice( ) | v1.2.612 or above
v1.3.728 |
Returns the latest price data for the specified Symbol, Field, Price Calculation Type and Date
Currency and Unit of Measure conversion available |
Please note – it is not recommended to nest any Fastmarkets functions inside another Fastmarkets function.
Let’s explore the functions individually to see how you can make Fastmarkets’ Excel Add-in work best for you.
The GetInstruments( ) function enables you to view a list of all symbols and their corresponding reference data to which you’re entitled in your data package. The table below provides a summary of this function.
| Name | Description |
| Function summary | The GetInstruments( ) function fetches all symbols and corresponding reference data that the user is authorized to access. |
| Input parameters | VerticalHorizontalOrder; Filter |
| Output for the function | Inserts fields of data for each price, including Symbol, Currency, Unit of measure, Product, Location, Incoterm, Commodity, Price Type, Frequency, Source, Status and Description. |
| Example | =GetInstruments(“V”,“steel”) |
Get the list of prices and their symbols
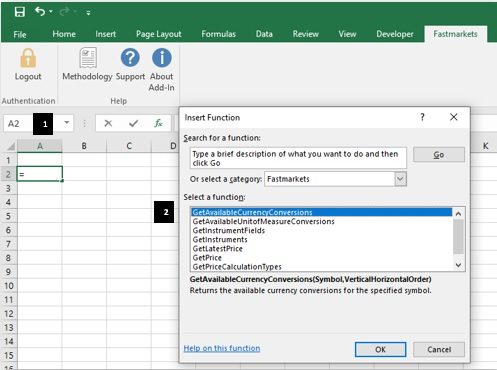
1. Select a cell where you want the prices to be displayed (for example, A2)
2. Click on the “function wizard” icon (fx). Choose the “Fastmarkets” category, select the “GetInstruments” function and click OK.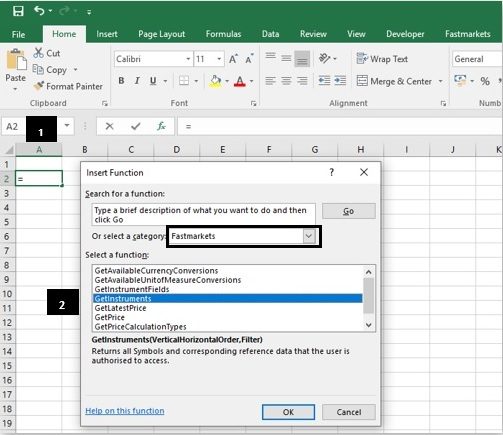 3. To display the full list of symbols and prices available for the data package you have chosen, leave the parameters blank and click OK. If you wish to filter the list so that you only see, say, aluminium symbols and prices, type “aluminium” in the “Filter” field.
 The list of all available prices will be inserted in the sheet (see following table). The first column contains the symbol unique to each price. The remaining columns contain the corresponding reference data (currency, unit of measure, product, location, incoterm, commodity, price type, frequency, source, status and description).
 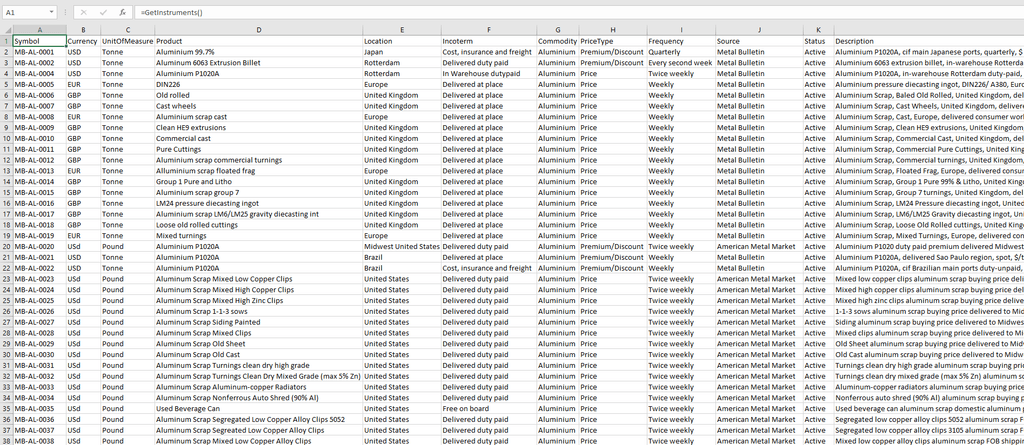 Please review the Appendix for a complete description of what each field displays.
The GetPriceCalculationTypes( ) function will identify the price calculation types that are available for each symbol. Use this function as a starting point to determine the type of data you wish to return – whether it is “Actual” for assessed physical prices or an average price for a particular frequency – “WeeklyAverage”, “MonthlyAverage”, “QuarterlyAverage” or “YearlyAverage”.
This release introduces a new ‘Weighted Average of Trades’ Price Calculation Type required for Cobalt instruments. Please note this Price Calculation Type is only available for the following instruments:
• MB-CO-0004 – Cobalt alloy grade, in-whs Rotterdam, $/lb
• MB-CO-0005 – Cobalt standard grade, in-whs Rotterdam, $/lb
NOTE: London Metal Exchange averages are not yet available through Fastmarkets’ Excel Add-in.
The parameters will enable you to easily populate a table to compare actual physical pricing and corresponding averages for a symbol across the same row or column.
The averages price calculation methodology for Fastmarkets US prices changed as of January 2021. You can find out more here: Fastmarkets Averages Changes
The table below provides a summary of this function.
| Name | Description |
| Function summary | The GetPriceCalculationTypes( ) function fetches the price calculation types for a specified symbol. |
| Input parameters | Symbol; VerticalHorizontalOrder |
| Output for the function | Inserts price calculation types for each symbol – for example, Actual, WeeklyAverage, WeeklyAverageFriThur, WeightedAverageofTrade, MonthlyAverage, QuarterlyAverage, YearlyAverage. |
| Example | =GetPriceCalculationTypes(“MB-AL-0004”,“H”) |
Get a list of Price Calculation Types for your specified symbol(s)
1. Select a cell where you want the prices to be displayed (for example, A2).
2. Click on the “function wizard” icon (fx). Choose the “Fastmarkets” category, select the “GetPriceCalculationTypes” function and click OK.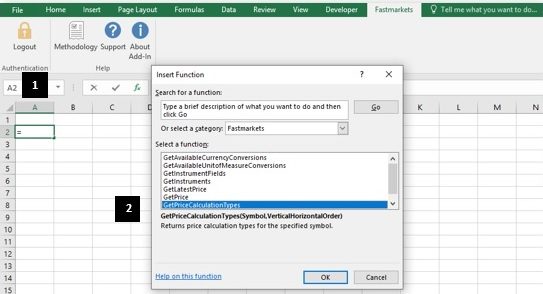 3. Enter the symbol. In this example we’re using MB-AL-0004
4. For the “VerticalHorizontalOrder” field, enter “V” if you want the Price Calculation Types to appear vertically or “H” if you want the Price Calculation Types to appear horizontally. This field is optional, if you leave it blank the values will return horizontally by default. In this example we will leave it blank. Then click OK.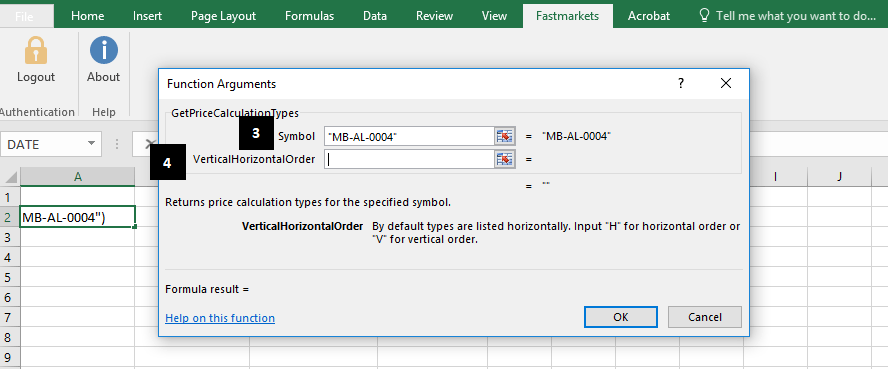
The Price Calculation Types will return as in the screenshot below.
 The screenshot below shows how the Price Calculation Types return if the “VerticalHorizontalOrder” field is set to “V”.
The GetInstrumentFields( ) function can be used to identify the fields that are available for each symbol and price calculation type. Remember, each Fastmarkets price has a symbol – an alphanumeric code unique to that price.
Some fields provide reference data, such as currency and unit of measure. and other pivotal data fields including:
- ShortDescription: This shows the short description for the instrument.
- LaunchDate: This shows the date on which the instrument was first launched
- Source: This shows the source of the instrument.
- Correction: A TRUE/FALSE flag to show if a value has been corrected. This will update automatically in your spreadsheet.
- Period: The Period field will return the same value as the AssessmentDate field for “Actual” physical pricing or the average period for the PriceCalculationType (for example, MonthlyAverage would return “Oct 2019”).
- Appraisal Price: A TRUE/FALSE flag to denote that an appraisal – or interim – price has been published between assessment dates and values.
- Pricing Rationale: This field provides insight into how our price reporters and editors have determined the pricing for the instrument(s) selected. If no pricing rationale is provided, this field will remain blank.
A full description for all fields can be found in the Appendix.
The table below provides a summary of this function.
| Name | Description |
| Function summary | The GetInstrumentFields( ) function may be used to fetch the data fields that are available for a given symbol and Price Calculation Type. For example, exchange prices (to be introduced in later phases) will have different price fields from physical prices |
| Input parameters | Symbol; PriceCalculationType; VerticalHorizontalOrder |
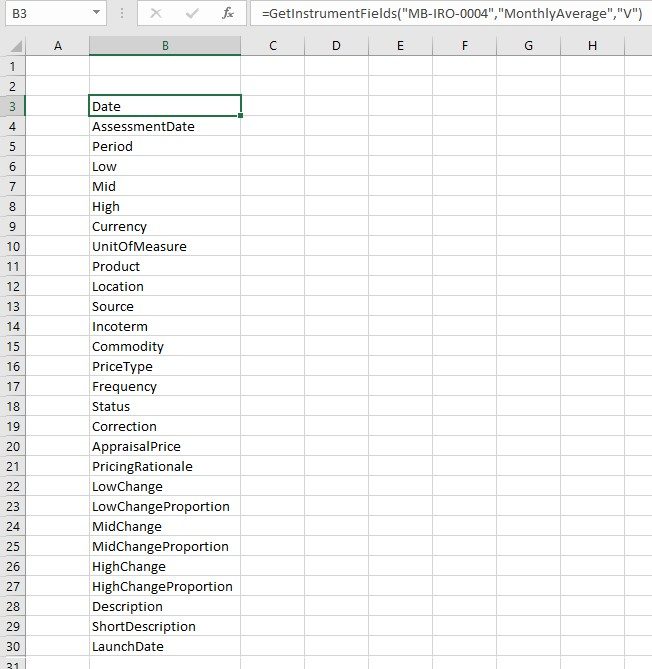
| Output for the function | Inserts an array displaying the available data fields. The fields available for actual and physical prices are: Date, AssessmentDate, Period, Low, Mid, High, Currency, UnitOfMeasure, Product, Location, Source, Incoterm, Commodity, PriceType, Frequency, Status, Correction, AppraisalPrice, PricingRationale, LowChange, LowChangeProportion,mMidChange, MidChangeProportion, HighChange, ighChangeProportion, Description, hortDescription and LaunchDate. |
| Example | =GetInstrumentFields(“MB-AL-0002”,”MonthlyAverage”,“V”) |
Get the data fields available for a particular price
1. Select the cell where you want the data fields to be inserted (for example, A2).
2. Click on the “function wizard” icon (fx), choose the “Fastmarkets” category, select the “GetInstrumentFields” function and click OK.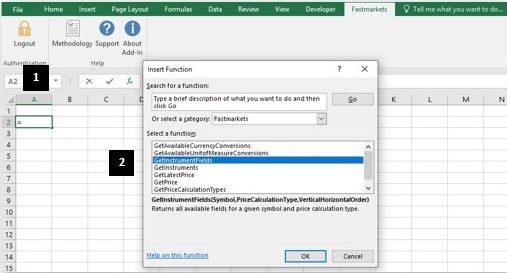
3. Enter the symbol. For this example, we’re using MB-IRO-0004.
4. Enter the PriceCalculationType. This field is optional; if left blank, it will return fields for “Actual” (actual physical prices). If you know the PriceCalculationType, enter it in speech marks (for example, “MonthlyAverage”). You can also cell reference it if you have used the GetPriceCalculationType function.
5. For the “VerticalHorizontalOrder” field, enter “V” if you want the data fields to appear vertically or “H” if you want the data fields to appear horizontally. (This field is optional; if left blank, it will return instrument fields horizontally.) Then click OK. The data fields available for the symbol will appear in the spreadsheet as shown in the following screenshot if you select “V” for Vertical order.
The screenshot below shows how the data fields would appear horizontally if “H” were typed into the “VerticalHorizontalOrder” field instead of “V” as referenced in Step 4. (Note: Several fields are cut off for the viewability of this screenshot.)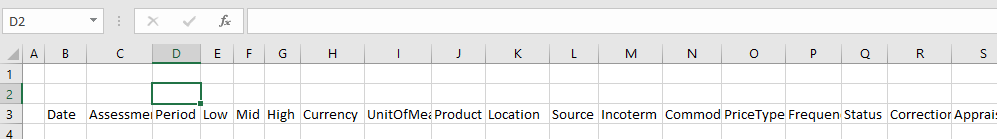
The GetLatestPrice( ) function enables you to view the latest price information for your chosen symbols and their price calculation types.
From this version it is now possible to convert price data to the currency and/or unit of measure specified through the TargetCurrency and TargetUnitOfMeasure parameters. These are optional parameters and if left blank price data will return in the assessed currency and unit of measure. Please refer to the Currency & Unit of Measure Conversion section for an example.
The table below provides a summary of this function.
| Name | Description |
| Function summary | The GetLatestPrice( ) function fetches the latest price data for the specified Symbol, Field, Price Calculation Type. If TargetCurrency and or TargetUnitofMeasure parameters are entered price fields will be converted to the specified currency and/or unit of measure. It can be used to get fields such as Low, Mid and High for actual physical prices or averages. Because the function applies to an individual cell, it gives the user control over the layout of the workbook. Once the table is laid out, the formula may be dragged or copied to populate all cells. |
| Input parameters | Symbol; PriceCalculationType; Field;TargetCurrency;TargetUnitOfMeasure |
| Output for the function | The result is inserted in a single cell; it represents the most recent price or average price data depending on your chosen price calculation type, target currency and/or target unit of measure. Currency and UnitofMeasure fields will return Assessed Currency and/or Unit of Measure if left blank or converted/target Currency and/or UnitofMeasure if specified. Note, if a price is updated every Monday and the user requests a price for Tuesday, Wednesday, Thursday or Friday, the function will return Monday’s price |
| Example | =GetLatestPrice(“MB-AL-0346”,”Actual”,“Low”) |
View the latest “Actual” – physical price data for one or more symbols
1. Copy the symbols for which you want to get the latest prices and paste them into a new sheet. For this example, we’ve chosen five aluminium premiums.
2. Fill in the column headers with the required price fields. Fastmarkets’ Excel Add-in supports the fields outlined in the table in the Appendix. For the example shown in the following screenshot, we’ve chosen Description, Low, High, Mid and AssessmentDate for our field.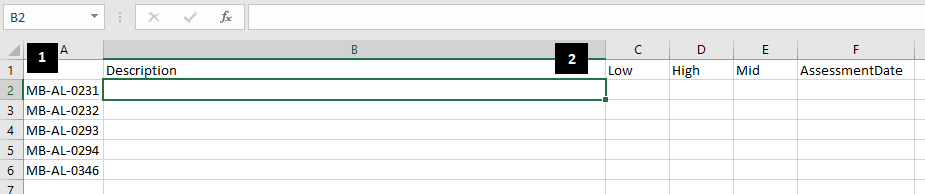 3. Select the cell where you want the first price to be inserted (for example, B2).
4. Click on the “function wizard” icon (fx). Choose the “Fastmarkets” category and select the “GetLatestPrice” function 5. Fill in the following parameters as shown:
Symbol: Type the cell reference where the first price symbol has been inserted and apply the dollar sign ($) to the column (for this example, type $A2, since that’s where symbol MB-AL-0231 has been inserted). Applying the $ will allow you to copy the formula over to other cells to fill out the table.
PriceCalculationType: This parameter enables you to determine the type of data to return for the symbol (physical pricing or averages). The parameter is optional; if left blank, it will return “Actual” for physical pricing. In this example, we will leave it blank.
Field: Type the cell reference where the first price field has been inserted and apply the dollar sign ($) to the row (for this example, type B$1, since that’s where “Description” has been inserted). Applying the $ will allow you to copy the formula over to other cells.
TargetCurrency: This is an optional parameter, if left blank it will return the assessed currency for the price. For this example, we will leave it blank.
TargetUnitOfMeasure: This is an optional parameter, if left blank it will return the assessed unit of measure for the price. For this example, we will leave it blank.
6. Click OK The description of the instrument has now been inserted into cell B2 (see screenshot below).
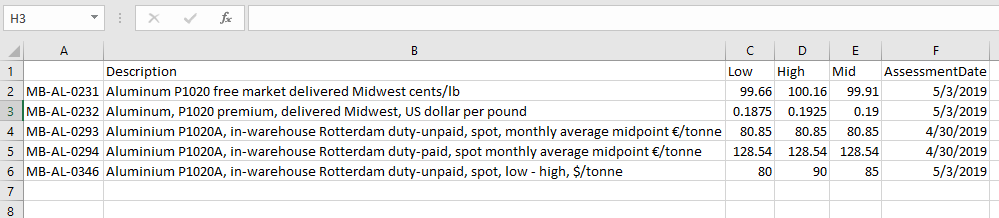 7. Copy the formula over to get the information for all of the data fields you’re seeking (see following screenshot). You can either grab the little square in the corner of the cell with the function in it and drag it across and down to highlight your entire table; or you can copy and paste the cell with the function in it into your entire table. Because you applied the dollar sign ($) in the formula, all retrieved data will point to one of the price symbols in Column A and to one of the fields in Row 1.
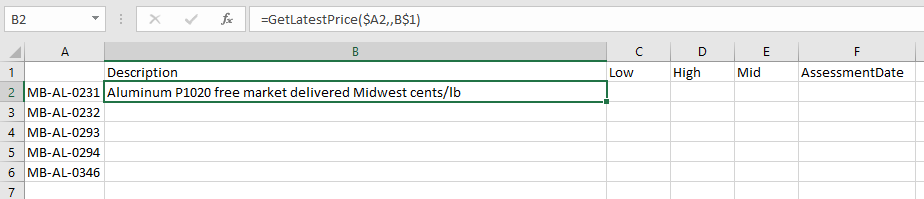 Refreshing the latest pricing data
Depending on your Excel settings, your pricing data may update automatically. If your Excel is set to update calculations automatically, you may simply refresh the data. To change this setting, go to Options -> Formulas -> Calculation options and change Workbook Calculation from Automatic to Manual. If Workbook Calculation is set to manual, the keystrokes are as follows:
– F2 and Enter to update a specific cell
– Ctrl + Alt + F9 to update the entire spreadsheet
View the latest monthly average price data for one or more symbols
Fastmarkets produces independent, fair and representative price assessments and indexes of ferrous, non-ferrous and scrap metal prices on a daily, bi-weekly, weekly, bi-monthly or monthly basis. Fastmarkets calculates and publishes monthly averages based on these independent, proprietary assessments which can be easily retrieved using the Excel Add-in. For details on how these monthly averages are calculated, please review our methodology documentation at www.fastmarkets.com/methodology
1. Copy the symbols for which you want to get the latest monthly average prices and paste them into a new sheet. For this example, we’ve chosen the same five aluminium premiums from the example above.
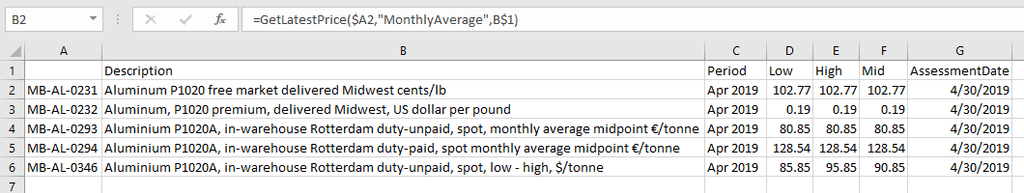
2. Fill in the column headers with the required price fields. Fastmarkets’ Excel Add-in supports the fields outlined in the table in the Appendix for averages AND actual physical prices. For this example, we’ve chosen Description, Period, Low, High, Mid and AssessmentDate. Period is a useful new field that allows you to view the week date range, month/year or year for the average data you specify. 3. Select the cell where you want the first price to be inserted (for example, B2).
4. Click on the “function wizard” icon (fx). Choose the “Fastmarkets” category and select the “GetLatestPrice” function.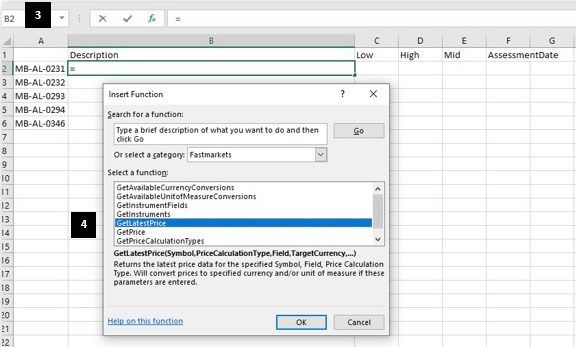 Fill in the parameters as shown below:
Symbol: Type the cell reference where the first price symbol has been inserted and apply the dollar sign ($) to the column (for this example, type $A2, since that’s where symbol MB-AL-0231 has been inserted). Applying the $ will allow you to copy the formula over to other cells to fill out the table.
PriceCalculationType: To retrieve averages, this field needs to have a value entered. If you are unsure of what to enter, please refer to the earlier section on the GetPriceCalculationType function. For this example, enter “MonthlyAverage”.
Field: Type the cell reference where the first price field has been inserted and apply the dollar sign ($) to the row (for this example, type B$1, since that’s where “Description” has been inserted). Applying the $ will allow you to copy the formula over to other cells.
TargetCurrency: In this example,it is left blank to return the assessed currency for the price.
TargetUnitOfMeasure: In this example, it is left blank to return the assessed unit of measure for the price.
6. Click OK.
The description of the instrument has now been inserted into Cell B2, as shown below.

7. Copy the formula over to get the information for all of the data fields you’re seeking (see following screenshot). You can either grab the little square in the corner of the cell with the function in it and drag it across and down to highlight your entire table; or you can copy and paste the cell with the function in it into your entire table. Because you applied the dollar sign ($) in the formula, all retrieved data will point to one of the price symbols in Column A and to one of the fields in Row 1.
An important note on monthly averages
Why am I not able to retrieve monthly average prices for US weekly scrap composites?
The following weekly scrap composite prices are an average of the daily composite prices calculated for the week from Friday to Thursday. Published monthly averages are not available for these prices. The corresponding daily composite price should be used to retrieve monthly average prices. The averages price calculation methodology for Fastmarkets US prices changed as of January 2021. You can find out more here: Fastmarkets Averages Changes.
|
Daily Composite
|
Weekly Composite – WeeklyFriThurAverage
|
||
| Symbol | Description | Symbol | Description |
| MB-STE-0217 | Alabama Shredded auto scrap consumer buying price $/gross ton | MB-STE-0519 | Alabama shredded auto scrap consumer buying price US$/gross ton weekly composite |
| MB-STE-0228 | Chicago No. 1 heavy melt scrap consumer buying price $/gross ton | MB-STE-0528 | Chicago no. 1 heavy melt consumer buying price US$/gross ton weekly composite |
| MB-STE-0232 | Chicago No. 1 busheling scrap consumer buying price $/gross ton | MB-STE-0524 | Chicago no. 1 busheling scrap consumer buying price US$/gross ton weekly composite |
| MB-STE-0233 | Chicago Shredded auto scrap consumer buying price $/gross ton | MB-STE-0520 | Chicago shredded auto scrap consumer buying price US$/gross ton weekly composite |
| MB-STE-0257 | Cleveland No. 1 busheling scrap consumer buying price $/gross ton | MB-STE-0525 | Cleveland no. 1 busheling scrap consumer buying price US$/gross ton weekly composite |
| MB-STE-0285 | Philadelphia No. 1 heavy melt scrap consumer buying price $/gross ton | MB-STE-0529 | Philadelphia no. 1 heavy melt consumer buying price US$/gross ton weekly composite |
| MB-STE-0289 | Philadelphia Shredded auto scrap consumer buying price $/gross ton | MB-STE-0521 | Philadelphia shredded auto scrap consumer buying price US$/gross ton weekly composite |
| MB-STE-0303 | Pittsburgh No. 1 heavy melt scrap consumer buying price $/gross ton | MB-STE-0530 | Pittsburgh no. 1 heavy melt consumer buying price US$/gross ton weekly composite |
| MB-STE-0306 | Pittsburgh No. 1 busheling scrap consumer buying price $/gross ton | MB-STE-0526 | Pittsburgh no. 1 busheling consumer buying price US$/gross ton weekly composite |
| MB-STE-0308 | Pittsburgh Shredded auto scrap consumer buying price $/gross ton | MB-STE-0522 | Pittsburgh shredded auto scrap consumer buying price US$/gross ton weekly composite |
| MB-STE-0426 | No. 1 heavy melt scrap daily composite $/gross ton | MB-STE-0531 | No. 1 heavy melt consumer buying price US$/gross ton weekly composite |
| MB-STE-0427 | Shredded auto scrap daily composite $/gross ton | MB-STE-0523 | Shredded auto scrap consumer buying price US$/gross ton weekly composite |
| MB-STE-0428 | No. 1 busheling scrap daily composite $/gross ton | MB-STE-0527 | No. 1 busheling scrap consumer buying price US$/gross ton weekly composite |
The GetPriceHistory( ) function enables you to view historical prices for a symbol. From this version, it is possible to convert price data to the currency and/or unit of measure specified through the TargetCurrency and TargetUnitOfMeasure parameters . These are optional parameters; if left blank, price data will be returned in the assessed currency and unit of measure. Please refer to the Currency & Unit of Measure Conversion section for an example.
The table below provides a summary of this function.
| Name | Description |
| Function Summary | The GetPriceHistory( ) function can be used to fetch the price history for a given symbol. The user can specify the price calculation type to determine whether to return physical price or average price history, start and end date, fill setting to determine how to fill gaps between data points, horizontal or vertical layout, ascending or descending dates, and whether to retrieve specific or all fields. If TargetCurrency and or TargetUnitofMeasure parameters are entered price data history will be converted to the specified currency and/or unit of measure, otherwise if blank the assessed currency and/or unit of measure is returned. |
| Input Parameters | Symbol; PriceCalculationType; StartDate; EndDate; FillSetting;VerticalHorizontalOrder; AscendingDescending; Field1…Field 8 NOTE – Nesting volatile Microsoft Excel functions such as =TODAY() or =NOW() into date parameter inputs is not recommended |
| Output for the function | Inserts a series table displaying historical dates and corresponding price fields. The PriceCalculationType parameter specifies if the function should return actual physical pricing or a type of average. The FillSetting parameter determines how to handle non-assessment days in the historical time series. If the FillSetting parameter is not specified, the default data will display “ValueOnly” (these are assessment-only dates and values). TargetCurrency and or TargetUnitofMeasure parameters are entered price data history will be converted to the specified currency and/or unit of measure, otherwise if blank the assessed currency and/or unit of measure is returned. The next table explains the choices available with this parameter. |
| Example | =GetPriceHistory(“MB-AL-0001”, “Actual”, “7/25/2014”, “2/27/2018”, “ValueOnly”, “V”, “A”, “Low”, Mid”, “High”, “Location”, “Currency”, “UnitOfMeasure”, “AssessmentDate”) |
The table below explains how the historical prices return with each Fill Setting within the parameter, enabling you to fully customize the time series data you work with.
| Fill Setting | Description |
| ValueOnly | The dates and prices returned will only display when assessed or published prices are available. For example, for a MonthlyAverage, the field will display dates and values once per month |
| CarryForward | If there is no updated price for a given day, the function will “carry forward” – or repeat – the last available price for ALL WEEKDAYS until the price is updated again NOTE: public holidays will not be excluded. For example, a price is assessed weekly, on Monday. For the subsequent Tuesday, Wednesday, Thursday and Friday, the function will return Monday’s price |
| Null | ALL WEEKDAYS INCLUDING HOLIDAYS will be displayed in the Date column. If there is no updated price for a given date, the corresponding row will be blank. |
View the physical price history for a particular symbol
1. Select the cell where you want the price history to be inserted (for example, B4).
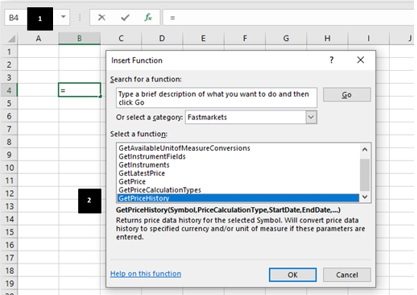
2. Click on the “function wizard” icon (fx), choose the “Fastmarkets” category, select the “GetPriceHistory” function and click OK.
3. Fill in the Symbol field ONLY. This is the quickest way to get the full physical price history for assessment-only dates. You may fill in the StartDate and EndDate fields if you wish to narrow the price history to a specific range. The date format (mm/dd/yyyy versus dd/mm/yyyy) will be recognized based on your regional date and time settings. For this example, we will use the symbol “MB-STE-0566”.
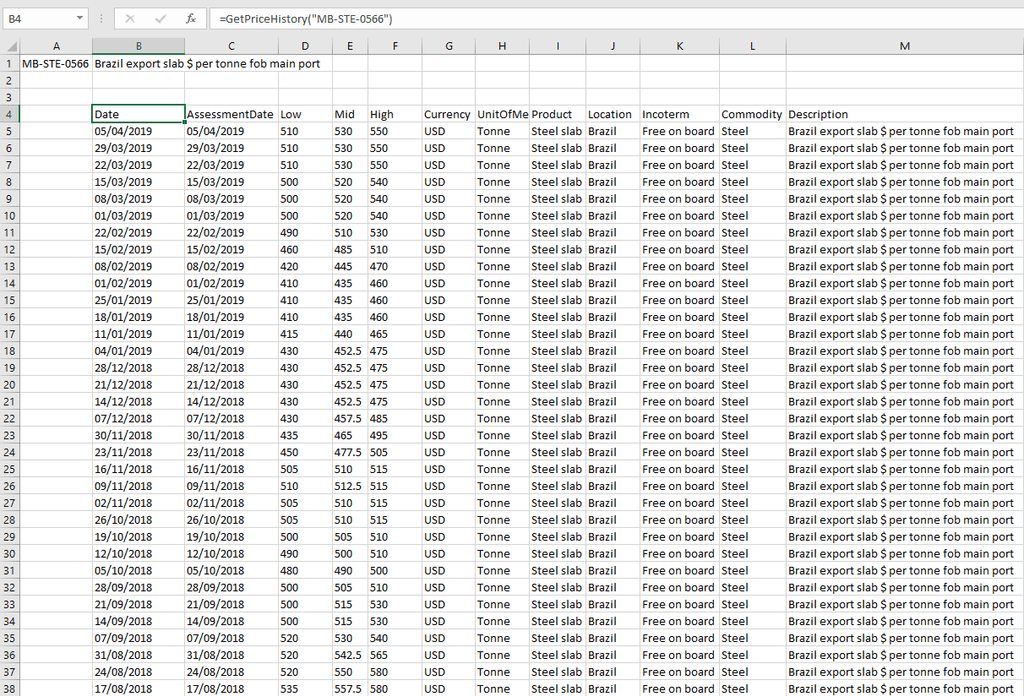
4. Click OK.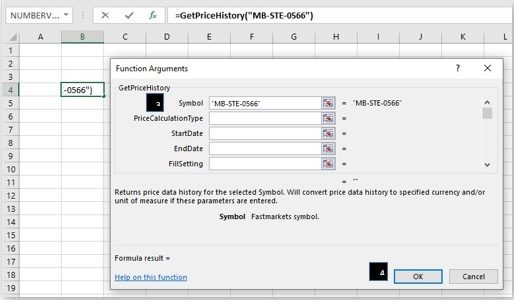 The price data history has now been inserted into the sheet.
The GetPriceHistory( ) function also allows you to customize the way the price history is displayed in your spreadsheet. The following three, step-by-step examples show how the FillSetting parameter can be used to customize your returned data. The second and third examples (“CarryForward” and “Null”) are particularly useful if you plan to align, in your spreadsheet, the returned data with your own data or other sources of daily published data.
– “ValueOnly”: returns prices on their assessment dates
– “CarryForward”: returns prices for every weekday which are “carried forward” or repeated between assessment dates
– “Null”: returns all weekdays but displays prices only on their assessment date, other dates are blank
NOTE: PUBLIC HOLIDAYS ARE NOT EXCLUDED. Fill Settings “Null” and “CarryForward” will return ALL WEEKDAYS. This is important to note if manually calculating an average period and comparing to published monthly average prices when entering “MonthlyAverage”.
“ValueOnly”: Return monthly average prices for assessment dates with specific data fields
1. Select the cell where you want the price history to be inserted (for example, B4).
2. Click on the “function wizard” icon (fx), choose the “Fastmarkets” category, select the “GetPriceHistory” function and click OK – just as you did before.
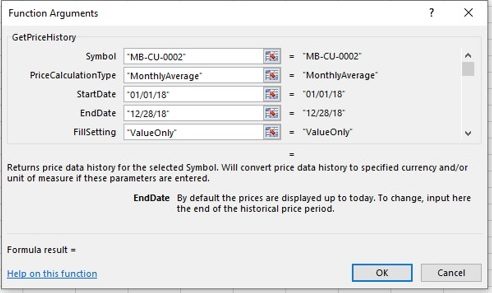
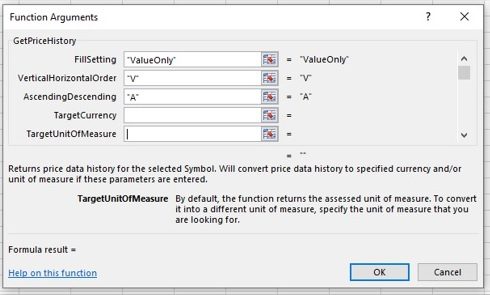
3. Fill in the parameters as below:
Symbol: For this example, we’ll use the symbol “MB-CU-0002”.
PriceCalculationType: “MonthlyAverage”
StartDate: “01/01/18” (January 1, 2018)
EndDate: “12/28/18” (December 28, 2018)
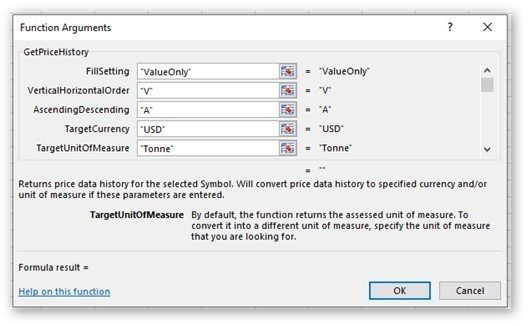
FillSetting: “ValueOnly”
VerticalHorizontalOrder: “V”
AscendingDescending: “A”
TargetCurrency: In this example, it is left blank to return the assessed currency for the price.TargetUnitOfMeasure: In this example it is left blank to return the assessed unit of measure for the price.
Field1: “Date”
Field2: “Period”
Field3: “Mid”
Field4: “AssessmentDate”
The following three screenshots show all of the parameters entered into the function arguments as outlined above.
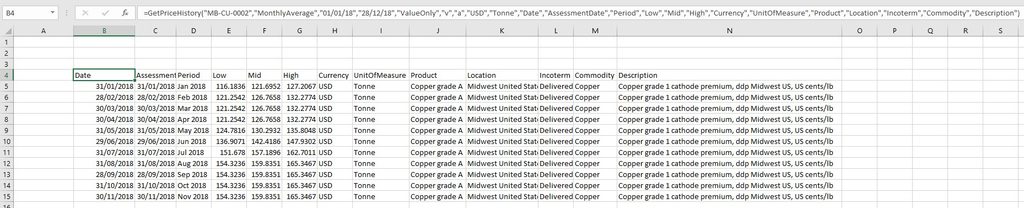
 Once you have finished populating the fields, click OK. The historical price table will flow into the sheet according to the specified parameters, as shown in the following screenshot. NOTE: These are average value on their published/assessed dates (holidays are factored in). This is the official Fastmarkets average for the instrument.
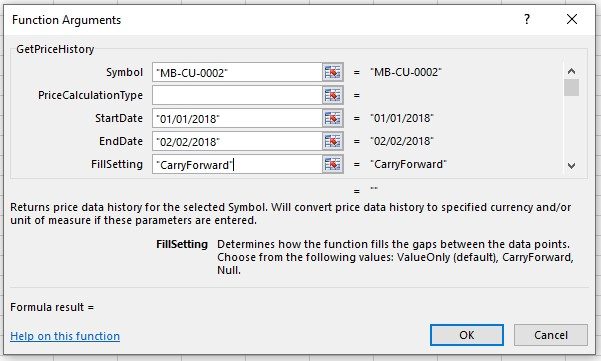
“CarryForward”: Return physical assessment prices with specific data fields that are rolled forward on non-assessment dates
1. Select the cell where you want the price history to be inserted (for example, B4).
2. Click on the “function wizard” icon (fx), choose the “Fastmarkets” category, select the “GetPriceHistory” function and click OK – just as you did before.
3. Fill in the parameters as below:
Symbol: For this example, we’ll use the symbol “MB-CU-0002”.
PriceCalculationType: This parameter enables you to determine the type of data to return for the symbol (physical pricing or averages). The parameter is optional; if left blank, it will return “Actual” for physical pricing. For this example, we will leave it blank.
StartDate: “01/01/18” (January 1, 2018)
EndDate: “02/02/18” (February 2, 2018)
FillSetting: “CarryForward”
VerticalHorizontalOrder: “V”
AscendingDescending: “A”
TargetCurrency: This is an optional parameter; if left blank, it will return the assessed currency for the price. We will leave it blank in this example.
TargetUnitOfMeasure: This is an optional parameter; if left blank, it will return the assessed unit of measure for the price. We will leave it blank in this example.
Field1: “Date”
Field2: “AssessmentDate”Field3: “Low”
Field4: “Mid”
Field5: “High”
The following screenshot shows the same example with the FillSetting parameter set to “CarryForward”.
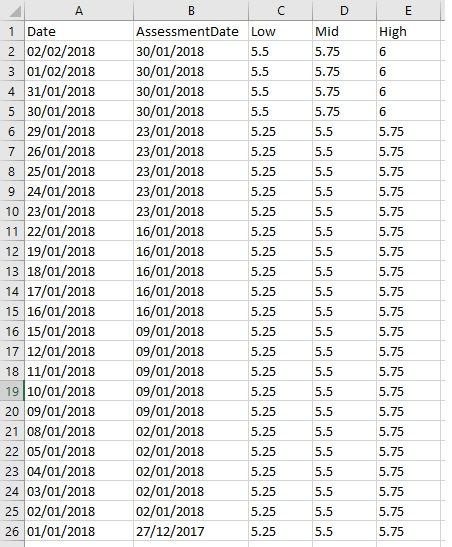
1. Once you have finished populating the fields, click OK. The historical price table will flow into the sheet according to the specified parameters, as shown in the following screenshot. These are physical price assessments for the instrument.
Note the difference between the “Date” column which displays every weekday, and the “AssessmentDate” column where the assessment date is “carried forward” on non-assessment dates, along with the corresponding prices.
Holidays are NOT factored in; if this format is used to calculate the average, please ensure holidays are manually removed from the calculation.
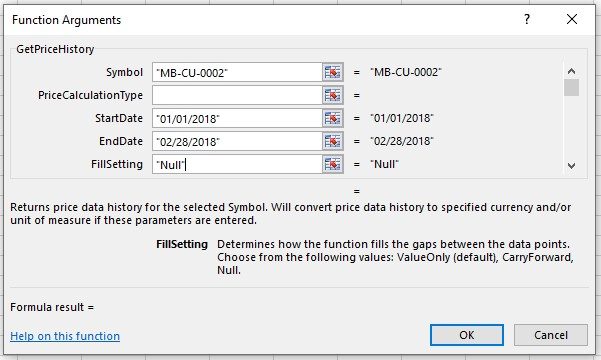
“Null”: Return physical assessment prices with specific data fields filled on their assessment dates but blank on non-assessment dates
1. Select the cell where you want the price history to be inserted (for example, B4).
2. Click on the “function wizard” icon (fx), choose the “Fastmarkets” category, select the “GetPriceHistory” function and click OK – just as you did before.
3. Fill in the parameters as below:
Symbol: For this example, we’ll use the symbol “MB-CU-0002”.
PriceCalculationType: This parameter enables you to determine the type of data to return for the symbol (physical pricing or averages). The parameter is optional; if left blank, it will return “Actual” for physical pricing. For this example, we will leave it blank.
StartDate: “01/27/18” (January 27, 2018)
EndDate: “02/28/18” (February 28, 2018)
FillSetting: “Null”
VerticalHorizontalOrder: “V”
AscendingDescending: “A”
TargetCurrency: This is an optional parameter; if left blank, it will return the assessed currency for the price. We will leave it blank in this example.
TargetUnitOfMeasure: This is an optional parameter; if left blank, it will return the asessed unit of measure for the price. We will leave it blank in this example.
Field1: “Date”
Field2: “AssessmentDate”
Field3: “Low”
Field4: “Mid”
Field5: “High”
The below screenshot shows the same example with the FillSetting parameter set to “Null”.
4. Once you have finished populating the fields, click OK. The historical price table will flow into the sheet according to the specified parameters, as shown below.

Historic pricing data: frequently asked questions.
1. What is the longest time series I can download?
All historical pricing data is available through Fastmarkets’ Excel Add-in. The length of the history will vary depending on when the price was launched.
2. Can I choose between daily/weekly/monthly average prices?
Daily physical pricing (“Actual”) and weekly, monthly and yearly prices are available for all metals instruments from version 1.2.612 and above.
3. How can I see if a price was corrected?
In case of a price correction, the function returns the latest available version of the price (the latest corrected value). A correction flag field – “Correction” – is available in Fastmarkets’ Excel Add-In version 1.2.612 and above. An output of “TRUE” denotes a price that has been corrected; an output of “FALSE” denotes a price not requiring a correction.
4. Are non-assessment days excluded/included from the time series?
The FillSetting parameter enables you to customize how time series data returns using the GetPriceHistory( ) function. Select from “ValueOnly” for assessment-only dates and prices; “CarryForward” to have the function roll the last available price forward if there is no updated price for a given day; or “Null” to display prices on their assessment dates and empty cells if there is no updated price for a given day.
5. Are holiday calendars taken into account when displaying price history?
No. At present, Fastmarkets’ Excel Add-in displays all weekdays (including public holidays) between the start and end dates of the period if the FillSetting parameter is set to “CarryForward” or “Null”. We recommend retrieving price history for Fastmarkets published averages using the Price Calculation Type rather than a manual calculation to ensure holidays are removed. However, we appreciate some customers will want to calculate averages manually, please note to remove public holidays as above. Please refer to Fastmarkets’ methodology for more information on holiday calendars for specific ferrous and non-ferrous market prices and averages: www.fastmarkets.com/methodology.
6. Can I use other Microsoft Excel functions such as =TODAY() or =NOW() to calculate or automate a specific date or number of days/periods in the GetPriceHistory() function?
No. It is not recommended to nest or use volatile Microsoft Excel functions such as =TODAY() or =NOW() with Fastmarkets functions. For advice or assistance with this, please contact our Customer Success team: customersuccess@fastmarkets.com
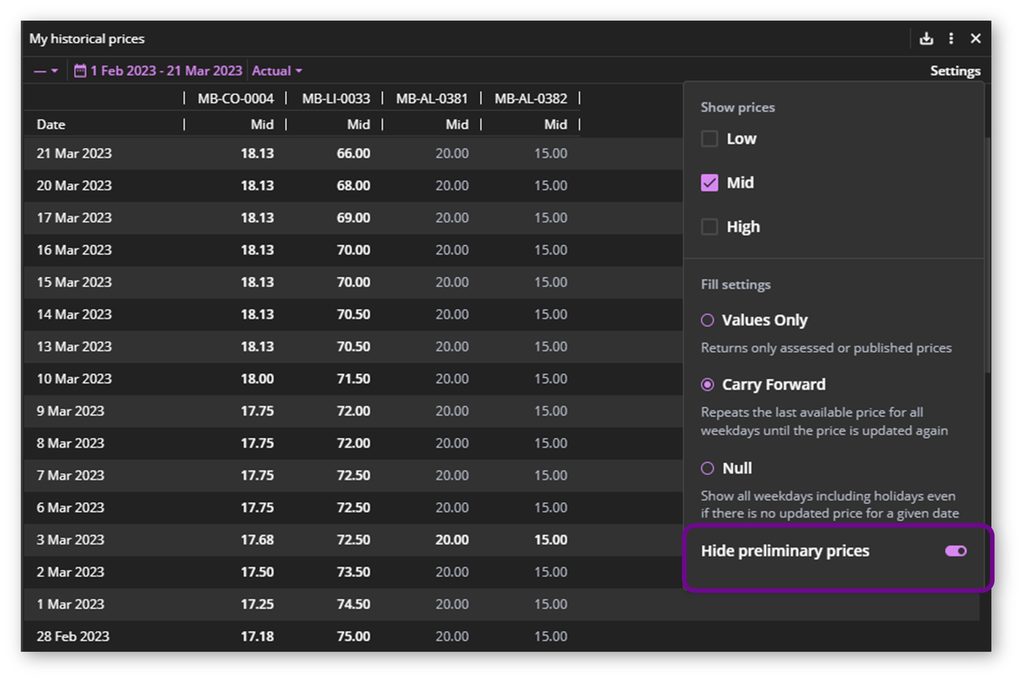
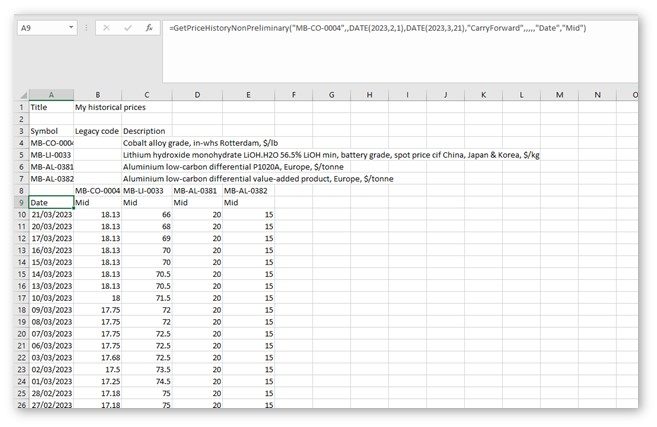
GET PRICE HISTORY NON PRELIMINARY
The GetPriceHistoryNonPreliminary( ) function enables you to view historical prices for a symbol, providing results without preliminary prices when exporting from the Fastmarkets Dashboard.
All parameters & functionality remain the same as the above GetPriceHistory function.
Below are examples where preliminary prices have been hidden (in the widget Settings panel) when exporting from the Dashboard and the results when copied for Excel Add-in:
The GetPrice( ) function enables you to view the price for one or more symbols and price calculation types as of a given date.
The table below provides a summary of this function.
| Name | Description |
| Function summary | The GetPrice( ) function fetches the price for a symbol and price calculation type as of a given date. It can be used to get the High, Mid and Currency fields, among others. Because the function applies to an individual cell, it gives the user control over the layout of the workbook. Once the table is laid out, the formula may be dragged or copied to fill other cells. If TargetCurrency and or TargetUnitofMeasure parameters are entered, the price data history will be converted to the specified currency and/or unit of measure, otherwise if blank the assessed currency and/or unit of measure is returned. |
| Input parameters | Symbol; PriceCalculationType; Field; Date; TargetCurrency (may be left blank);TargetUnitOfMeasure (may be left blank). NOTE: Nesting volatile Microsoft Excel functions such as =TODAY() or =NOW() into date parameter inputs is not recommended. |
| Output for the function | Inserts a single field (such as High, Low, Currency) into the selected cell that represents the most recent price data as of the given date. The Excel Add-in rolls the last available price forward. For example, a price is updated on Monday. For the subsequent Tuesday, Wednesday, Thursday and Friday, the function will return Monday’s price. TargetCurrency and or TargetUnitofMeasure parameters are entered price data history will be converted to the specified currency and/or unit of measure; if left blank, the assessed currency and/or unit of measure is returned. |
| Example | =GetPriceData(“MB-AL-0001”, “Low”,“07/02/2018”) |
Get the price(s) for a specific date
1. Copy and paste the required symbol(s) into a new sheet. For this example, we’re using symbols “MB-FEU-0001″, “MB-FEV-0001,” “MB-FEV-0002” and “MB-FEV-0003.”
2. Insert the date for which you want to display the price(s). For this example, we’re using June 26, 2018.
3 . Fill in the column headers with the required price fields. Fastmarkets’ Excel Add-in supports the fields outlined in the table in the Appendix. For this example, we’re using Low, High, Mid, UnitOfMeasure and AssessmentDate.
4. Select the cell where you want the first price to be inserted (for example, C2).
5. Click on the “function wizard” icon (fx), choose the “Fastmarkets” category and select the “GetPrice” function. Then click OK.
6. Fill in the parameters as below:
Symbol: Click on the cell where the first price symbol has been inserted (in this example, A2). Apply the dollar sign ($) sign to the column ($A2). This will allow you to copy the formula to other cells.
Field: Click on the cell where the first price field – “Low” – has been inserted (in this example, C1). Apply the dollar sign ($) sign to the row (C$1). This will allow you to copy the formula to other cells.
Date: Click on the cell where the date has been inserted (in this example, B2). Apply the dollar sign ($) sign to the row ($B2). This will allow you to copy the formula to other cells.
TargetCurrency: This is an optional parameter, if left blank it will return the assessed currency for the price. We will leave it blank in this example.
TargetUnitOfMeasure: This is an optional parameter, if left blank it will return the assessed unit of measure for the price. We will leave it blank in this example.
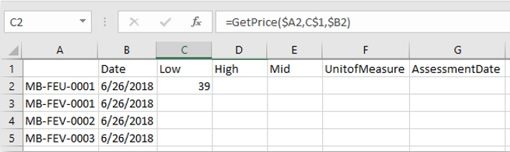
7. Click OK. 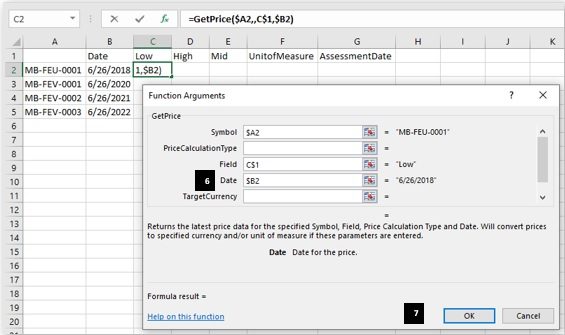
The low price for the first The low price for the symbol – “MB-FEU-0001” – will appear in cell C2, as shown in the following screenshot.
 8. Copy the formula over to get the information for all of the data fields you’re seeking (see following screenshot). You can either grab the little square in the corner of the cell with the function in it and drag it across and down to highlight your entire table; or you can copy and paste the cell with the function in it into your entire table. Because you applied the dollar sign ($) sign in the formula, all retrieved data will point to one of the price symbols in Column A and to one of the fields in Row 1.

NOTE: If you are retrieving monthly average prices for a specific period, it is recommended that you request the last date of the month. Monthly average prices are published and stored historically on the last working day of each month. For example, to retrieve the monthly average for April 2019, enter 04/30/2019 in the date parameter – not 04/01/2019. Entering 04/01/2019 will return the monthly average for March (the latest average value for that date).
The GetAvailableCurrencyConversions( ) function will identify the currency conversions that are available for each symbol for which you choose to convert pricing data. Use this function as a starting point to determine the TargetCurrency input parameter for use in the GetPrice, GetLatestPrice and GetPriceHistory functions above to convert your prices into a different currency.
The table below provides a summary of this function.
| Name | Description |
| Function summary | The GetAvailableUnitOfMeasureConversions( ) function fetches the available unit-of-measure conversions for a specified symbol(s) |
| Input parameters | Symbol; VerticalHorizontalOrder |
| Output for the function | Inserts available unit-of-measure conversions for each symbol (for example, Tonne, Kilogram, Pound, LongTon, ShortTon |
| Example | =GetAvailableUnitOfMeasureConversions(“MB-AL-0004”,“H”) |
Get a list of available currency conversions for your specified symbol(s)
1. Select a cell where you want the prices to be displayed (for example, A2).
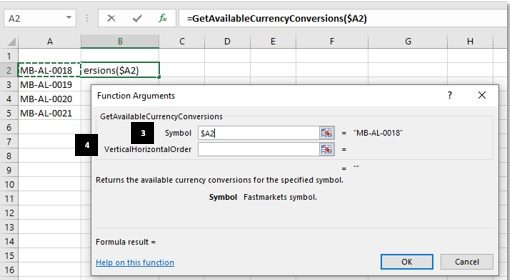
2. Click on the “function wizard” icon (fx). Choose the “Fastmarkets” category, select the “GetAvailableCurrencyConversions” function and click OK.
3. In this example we will return the available currency conversions for a list of symbols. (Note: The available currencies may differ, depending on the base currency of the symbols in the list.) Click on the cell where the first price symbol has been inserted (in this example, A2). Apply the dollar sign ($) sign to the column ($A2). This will allow you to copy the formula to other cells.
4. For the “VerticalHorizontalOrder” field, enter “V” if you want the data fields to appear vertically or “H” if you want the data fields to appear horizontally. This field is optional; if left blank, it will return instrument fields horizontally. We will leave it blank for this example. Then click OK.
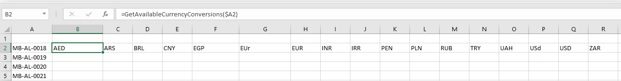
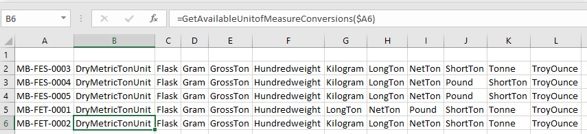
 The available currency conversions for the first symbol will return as in the screenshot below.
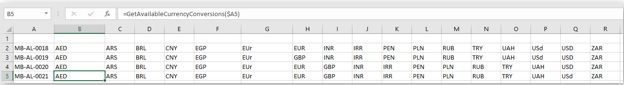
 5. Copy the formula over to get the available currencies for all of the symbols in the list. You can either grab the little square in the corner of the cell with the function in it and drag it across and down to highlight your entire table; or you can copy and paste the cell with the function in it into your entire table. Because you applied the dollar sign ($) sign in the formula, all retrieved data will point to one of the price symbols in Column A.
All available currency conversions will now be displayed and may differ between the symbols in your list depending on the base currency.
The GetAvailableCurrencyConversions( ) function will identify the currency conversions that are available for each symbol for which you choose to convert pricing data. Use this function as a starting point to determine the TargetCurrency input parameter for use in the GetPrice, GetLatestPrice and GetPriceHistory functions above to convert your prices into a different currency.
The table below provides a summary of this function.
| Name | Description |
| Function summary | The GetAvailableUnitOfMeasureConversions( ) function fetches the available unit-of-measure conversions for a specified symbol(s). |
| Input parameters | Symbol; VerticalHorizontalOrder |
| Output for the function | Inserts available unit-of-measure conversions for each symbol (for example, Tonne, Kilogram, Pound, LongTon, ShortTon) |
| Example | =GetAvailableUnitOfMeasureConversions(“MB-AL-0004”,“H”) |
Get a list of available currency conversions for your specified symbol(s)
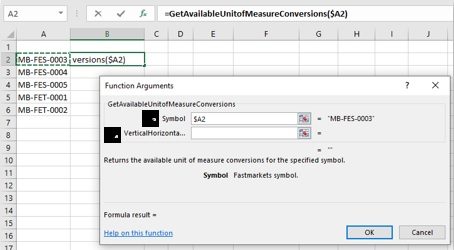
1. Select a cell where you want the prices to be displayed (for example, A2).
2. Click on the “function wizard” icon (fx). Choose the “Fastmarkets” category, select the “GetAvailableCurrencyConversions” function and click OK.
 3. In this example we will return the available currency conversions for a list of symbols. (Note: The available currencies may differ, depending on the base currency of the symbols in the list.) Click on the cell where the first price symbol has been inserted (in this example, A2). Apply the dollar sign ($) sign to the column ($A2). This will allow you to copy the formula to other cells.
4. For the “VerticalHorizontalOrder” field, enter “V” if you want the data fields to appear vertically or “H” if you want the data fields to appear horizontally. This field is optional; if left blank, it will return instrument fields horizontally. We will leave it blank for this example. Then click OK.
The available currency conversions for the first symbol will return as in the screenshot below.
5. Copy the formula over to get the available currencies for all of the symbols in the list. You can either grab the little square in the corner of the cell with the
function in it and drag it across and down to highlight your entire table; or you can copy and paste the cell with the function in it into your entire table. Because you applied the dollar sign ($) sign in the formula, all retrieved data will point to one of the price symbols in Column A.
All available currency conversions will now be displayed and may differ between the symbols in your list depending on the base currency.
The Fastmarkets Excel Add-in enables you to convert the assessed currency and/or unit of measure for prices so you can compare them on a like-for-like basis.
The Dashboard uses spot foreign exchange (FX) rates provided by third-party data provider that takes indicative rates from a wide range of FX venues, for current and historical currency conversion.
Daily rates on current pricing are provided by NetDania and update intraday (for conversion of published assessments and average prices) on a 30 minute basis until 23:00 UTC using the FX Bid price.
Historical published assessment prices are converted using the end of day conversion FX rate for the day the price was originally assessed.
Historical Fastmarkets published averages are converted using the end of day conversion FX rate for the day the average is published – for example, weekly average periods for assessments is Saturday to Friday.
Please note this FX rate is NOT averaged but is a snapshot taken at 23:00 UTC for the corresponding assessment date.
For further information about how our currency converter works please contact customersuccess@fastmarkets.com.
The following examples provide instructions on how to convert prices in your spreadsheet into the currency and/or unit of measure of your choice using the GetPrice(), GetLatestPrice() and GetPriceHistory() functions. You may wish to use the 2 new functions GetAvailableCurrencyConversions() and GetAvailableUnitofMeasureConversions() explained above to provide the necessary input parameters for your chosen TargetCurrency and TargetUnitOfMeasure.
Note: You may need to adjust the decimal place formatting to the returned results to display all decimal places. Any calculations based on those cells will calculate to the full available number of decimal places regardless of display formatting.
Convert the latest price data for one or more symbols to a different currency and unit of measure using the GetLatestPrice function
This example shows how to convert the different assessed currencies and units of measure for a table of prices into US cents per pound for ease of comparison. (If you only wish to convert either currency or unit of measure the TargetCurrency or TargetUnitOfMeasure parameters can be left blank at Step 5. If left blank the assessed currency or unit of measure will be returned.
Note: You may wish to use the GetAvailableCurrencyConversions() and GetAvailableUnitOfMeasureConversions() to check the available inputs for this example as available conversions for currency and unit of measure will differ depending on the assessed prices in your list.
1. Add the symbols for which you want to get the latest prices and paste them into a new sheet. For this example, we’ve chosen five aluminium premiums.
2. Fill in the column headers with the required price fields. Fastmarkets’ Excel Add-in supports the fields outlined in the table in the Appendix. For the example shown in the following screenshot, we’ve chosen Description, Low, High, Mid, AssessmentDate, Currency and UnitOfMeasure for our fields.

3, Select the cell where you want the first price to be inserted (for example, B2).
4. Click on the “function wizard” icon (fx). Choose the “Fastmarkets” category and select the “GetLatestPrice” function.

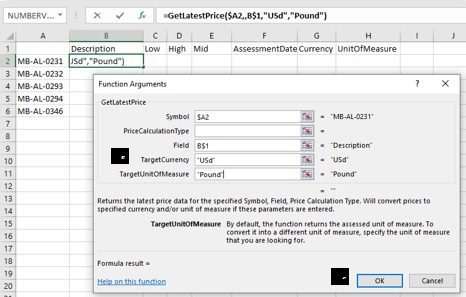
5. Fill in the following parameters as shown:
Symbol: Type the cell reference where the first price symbol has been inserted and apply the dollar sign ($) to the column (for this example, type $A2, since that’s where symbol MB-AL-0231 has been inserted). Applying the $ will allow you to copy the formula over to other cells to fill out the table.
PriceCalculationType: This parameter enables you to determine the type of data to return for the symbol (physical pricing or averages). The parameter is optional; if left blank, it will return “Actual” for physical pricing. In this example, we will leave it blank.
Field: Type the cell reference where the first price field has been inserted and apply the dollar sign ($) to the row (for this example, type B$1, since that’s where “Description” has been inserted). Applying the $ will allow you to copy the formula over to other cells.
TargetCurrency: If left blank it will return the assessed currency, if a target currency is entered that is what will be displayed. In this example we will enter “USd” for all prices to be converted to US cents. Note: to find the available conversions for your chosen symbols please refer to the GetAvailableCurrencyConversions function section.
TargetUnitOfMeasure: If left blank it will return the assessed unit of measure; if a target unit of measure is entered, that is what will be displayed. In this example we will enter “Pound”. Note: To find the available units of measure for your chosen symbols, please refer to the GetAvailableUnitofMeasureConversions() function section.
6. Click OK.
The description of the instrument has now been inserted into cell B2, as shown below.
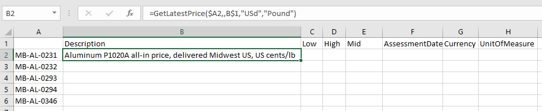
7. Copy the formula over to get the information for all of the data fields you’re seeking (see following screenshot). You can either grab the little square in the corner of the cell with the function in it and drag it across and down to highlight your entire table; or you can copy and paste the cell with the function in it into your entire table. Because you applied the dollar sign ($) in the formula, all retrieved data will point to one of the price symbols in Column A and to one of the fields in Row 1.
The prices will return converted into US cents per pound, and the Currency and UnitOfMeasure fields will return USd and Pound respectively.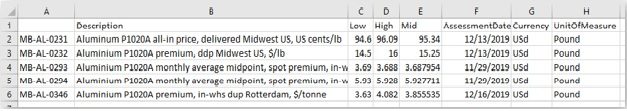
Return converted price history for monthly average prices for assessment dates with default data fields
This example uses the GetPriceHistory() function and shows how to convert the historical monthly average prices from the assessed currency and units of measure (US cents per pound) for one price into US dollars per tonne. It uses the default fields returned by the GetPriceHistory() function, and this example will return historical prices for assessment dates. Please refer to the GetPriceHistory() function section for more information on how to work with specific data fields or to return historical prices for actual physical price assessments instead of averages.
If you only wish to convert either currency, the TargetUnitOfMeasure parameter ay be left blank at Step 3. If you only wish to convert the unit of measure, the TargetCurrency parameter may be left blank at Step 3. If the parameters are left blank, the assessed currency and unit of measure will be returned.
Note: You may wish to use the GetAvailableCurrencyConversions and GetAvailableUnitOfMeasureConversions to check the available inputs for this example as available conversions for currency and unit of measure will differ depending on the assessed prices in your list.
1. Select the cell where you want the price history to be inserted (for example, B4).
2. Click on the “function wizard” icon (fx), choose the “Fastmarkets” category, select the “GetPriceHistory” function and click OK.
3. Fill in the parameters as below: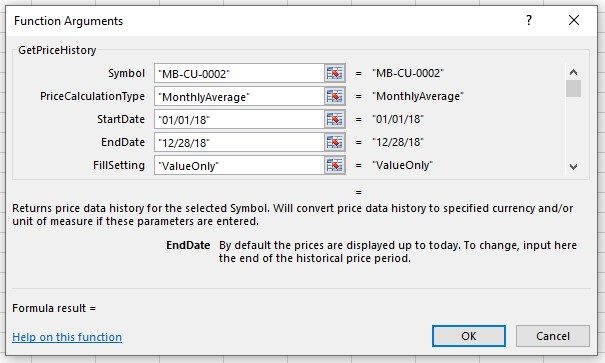

4. Once you have finished populating the fields, click OK. The historical price table will flow into the sheet according to the specified parameters. As shown below, the Low, Mid and High price fields have been converted into US Dollars per tonne and the Currency and UnitOfMeasure fields are displaying the target currency and unit of measure selected selected.
 Convert price(s) for a specific date into a specified currency or unit of measure using the GetPrice() function
This example enables you to view converted prices for multiple symbols and price calculation types as of a given date in a currency and/or unit of measure you choose. The assessed currency for all symbols in this example is US dollars, and the unit of measure is either kilogram or pound. Here, we will convert all of the selected prices into euros per pound.
Please refer to the Get Price History function section for more information on how to work with specific data fields or to return prices for averages for this function.
1. If you only wish to convert the currency, the TargetUnitOfMeasure parameter may be left blank at Step 3. If you only wish to convert the unit of measure, the TargetCurrency parameter may be left blank at Step 3. If the parameters are left blank, the assessed currency and unit of measure will be returned. Note: You may wish to use the GetAvailableCurrencyConversions and GetAvailableUnitOfMeasureConversions to check the available inputs for this example as available conversions for currency and unit of measure will differ depending on the assessed prices in your list.
2. Copy and paste the required symbol(s) into a new sheet. For this example, we’re using symbols “MB-FEU-0001, “MB-FEV-0001,” “MB-FEV-0002” and “MB-FEV-0003.”
3. Insert the date for which you want to display the price(s). For this example, we’re using June 26, 2018.
4. Fill in the column headers with the required price fields. Fastmarkets’ Excel Add-in supports the fields outlined in the table in the Appendix. For this example, we’re using Low, High, Mid, Currency, UnitOfMeasure and AssessmentDate.
5. Select the cell where you want the first price to be inserted (for example, C2).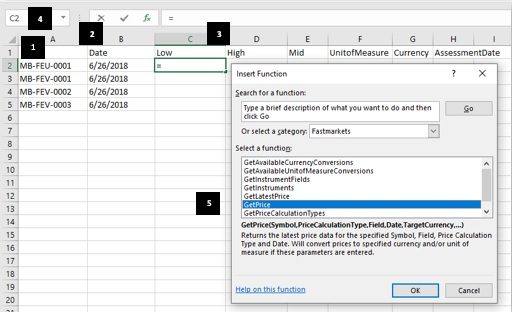
Click on the “function wizard” icon (fx), choose the “Fastmarkets” category and select the “GetPrice” function. Then click OK.
6. Fill in the parameters as below:
Symbol: Click on the cell where the first price symbol has been inserted (in this example, A2). Apply the dollar sign ($) sign to the column ($A2). This will allow you to copy the formula to other cells.
Field: Click on the cell where the first price field – “Low” – has been inserted (in this example, C1). Apply the dollar sign ($) sign to the row (C$1). This will allow you to copy the formula to other cells.
Date: Click on the cell where the date has been inserted (in this example, B2). Apply the dollar sign ($) sign to the row ($B2). This will allow you to copy the formula to other cells.
TargetCurrency: If left blank it will return the assessed currency, if a target currency is entered that is what will be displayed. In this example we will enter “EUR” for all prices to be converted to euros. Note: To find the available conversions for your chosen symbols please refer to the GetAvailableCurrencyConversions() function section.
TargetUnitOfMeasure: If left blank, it will return the assessed unit of measure, if a target unit of measure is entered that is what will be displayed. In this example, we will enter “Pound”. Note: To find the available unit of measure for your chosen symbols please refer to the GetAvailableUnitofMeasureConversions() function section.
7. Click OK.
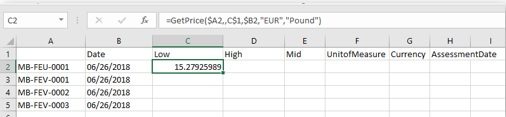
8. The low price for the first symbol – “MB-FEU-0001” – will appear in cell C2, as shown below.
9. Copy the formula over to get the information for all of the data fields you’re seeking (see following screenshot). You can either grab the little square in the corner of the cell with the function in it and drag it across and down to highlight your entire table; or you can copy and paste the cell with the function in it into your entire table. Because you applied the dollar sign ($) sign in the formula, all retrieved data will point to one of the price symbols in Column A and to one of the fields in Row 1.
The prices that are returned will be in euros per pound, and the Currency and UnitOfMeasure fields will return EUR and Pound respectively.
| Error message | Description/example |
| #N/A Server error: Instrument does not exist | An invalid symbol was entered in the formula (for example, MB-AL-0000000001). |
| #N/A Server error: The date ‘01-01-2030′ represents future time. | The StartDate or EndDate represents future time. |
| #N/A Invalid field: (field name) | An invalid field was entered in the formula. For example, the user enters the following: GetPriceData(“MB-AL-0001”,”Open”,”07/03/2018”), which specifies the field “Open” that is not among the supported fields for physical prices. In this example, the error message will display: #N/A Invalid field: Open. |
| #N/A Invalid parameter: (parameter name) | A parameter is missing in the formula. For example, the user tries to create the GetPriceData function without specifying the date. In this instance, the error message will display: #N/A Invalid parameter: Date. |
| #N/A Invalid parameter: VerticalHorizontalOrder | An invalid value was entered for the VerticalHorizontalOrder parameter (something other than “H” or “V”). |
| #N/A Invalid parameter: AscendingDescending | An invalid value was entered for the AscendingDescending parameter (something other than “D” or “A”). |
| #N/A Invalid parameter: PriceCalculationType | Price calculation type cannot be found in the database. |
| #N/A Invalid parameter: FillSetting | The value entered for “FillSettings” is other than ”ValueOnly”,“CarryForward”, “Null”. |
| #N/A No Price available for selected calculation type | There is no price available for the selected price calculation type. |
| #N/A Invalid parameter: End Date | An invalid End Date parameter was entered (for example, the user-specified an End Date that comes before the Start Date). |
| #N/A Invalid parameter: Filter | An invalid Filter was entered in the GetReferenceData( ) function that doesn’t return any results. |
| #N/A Conversion between USD and CAD is not available | No currency conversion available for selected target/base currency pairing |
| #N/A Conversion between Tonne and NickeUnit is not available | No unit of measure conversion available for selected target/base unit of measure pairing |
| #N/A No price available for WeeklyAverage before ” | No data available for selected Symbol/Price Calculation type before specified start date |
| #N/A No conversion rate available to EUR for ” “ | No target currency conversion rate available for specified start date – error starts first available conversion rate time series date |
| #N/A No price available before “” | No physical price assessment time series available for specified start date – error states first available price (“Actual”) time series date |
| #N/A Log in required | You are not logged in. |
| #N/A Server error: You do not have access to instrument | You are not authorized to see the given price. |
| #N/A Update required | The user’s version is below the minimum supported version. |
| #N/A Timeout | A network error occurred. |
| #N/A Server error | A server error occurred. |
| #N/A No data for given date | No prices are available for the requested symbol and date. |
| #N/A N/A | Any other error case that is not covered above. |
| Field | Description | Result |
| Date | Date stamp for returned data. | dd/mm/yyyy or mm/dd/yyyy – Excel date value that defaults to user’s local date format |
| AssesmentDate | Date and time of most recent or specified assessment | dd/mm/yyyy or mm/dd/yyyy – Excel date value that defaults to user’s local date format |
| Period | Text field providing a description of the period where PriceCalculationType selected is an average | Note this will be blank if PriceCalculationType = Actual e.g. 17-23 Nov 2018 for a weekly average value |
| Low | Low price | e.g.88 |
| Mid | Mid price | e.g.99 |
| High | High price | e.g.90 |
| Currency | Currency description | eg. 3 letter ISO Currency Code EUR |
| UnitOfMeasure | Unit of measure description | e.g. Tonne |
| Product | Commodity product name | e.g. Aluminium 99.7% |
| Location | Instrument location of origin | e.g Japan |
| Source | Data source of assessed value | e.g. Fastmarkets RISI |
| Incoterm | Incoterm description | e.g. Cost, insurance and freight |
| Commodity | Commodity | e.g. Copper |
| Price Type | The type of published price | e.g. Index |
| Frequency | Frequency of assessment | e.g. Weekly |
| Status | Status description of symbol | e.g. Active, discontinued |
| Correction | Revision flag indicating a price value has been corrected | e.g. TRUE (price value has been corrected) or FALSE (price value has not been (corrected) |
| Preliminary price | Flag indicating a price is undergoing a preliminar or appraisal process prior to final assessment. Note – this may not be available for every symbol | e.g. TRUE (price is undergoing preliminary/appraisal process) or FALSE (price is not undergoing preliminary/appraisal process) |
| Pricing rational | Text information providing editorial rationale behind an assessment price. Note – this may not be available for every symbol | e.g. Premium unchanged with majority of participants out of the market due to year-end holidays. |
| LowChange | Difference between low price of previous assessment and low price of latest assessment | e.g. -1.0 |
| LowChange% | Difference between low price of previous assessment and low price of latest assessment expressed as a decimal value |
e.g. 0.01 = 1%, -0.01 = -1% |
| MidChange | Difference between mid-price of previous assessment and mid-price of the latest assessment | e.g. -1.0 |
| MidChange% | Difference between mid-price of previous assessment and mid-price of latest assessment expressed as a decimal value | e.g. 0.01 = 1%, -0.01 = -1% |
| HighChange | Difference between high price of previous assessment and high price of latest assessment |
e.g. -1.0 |
| HighChange% | Difference between high price of previous assessment and high price of latest assessment expressed as a decimal value |
e.g. 0.01 = 1%, -0.01 = -1% |
| Description | Full description of the instrument | e.g. Aluminium Scrap, Commercial turnings, United Kingdom, delivered consumer works, £ per tonne |
| ShortDescription | Short description of the instrument | e.g. Aluminium Scrap, Commercial turnings, United Kingdom, delivered consumer works, £ per tonne |
| LaunchDate | Date on which the instrument was first launched | dd/mm/yyyy or mm/dd/yyyy – Excel date value that defaults to user’s local date format |
A link to the latest Fastmarkets pricing holiday calendar can be found at the bottom of the methodology section here – www.fastmarkets.com/methodology