Support: Fastmarkets Dashboard
As part of the Fastmarkets platform, our dashboard provides you with customizable workspaces that are designed to help you find the latest price assessments, historical prices, exchange data, charts and news in one place. Giving you the ability to focus on the market information and prices most relevant to you.
All the essential information on how to get up and running on the dashboard
Join one of our regular Fastmarkets Dashboard online training sessions
In-depth guide to the Dashboard’s features and functionality.
Technical specifications and information for our Dashboard
Got questions? Take a look at our frequently asked questions page

All of the how-to video guides for the Dashboard features in one place.
Explore our metals and mining coverage
View our price assessment process and methodologies
Download and view our latest metals price list to discover our metals physical assessments, OTC, exchange and short term forecast pricing
June 2025
- News API – extended search functionality
- Fastmarkets Dashboard now available on tablet devices
- Date picker improvements on all price widgets
- New short-term forecast prices & analysis launched for scrap and steel
- Harmonisation of short-term forecast content for coal and iron
For further information please refer to our Release Notes here
May 2025
- New – Gigafactory Capacity Database enhanced with pCAM/CAM production facilities – access via pre-built market page
- Palm Oil and Used Cooking Oil Interactive Market Pages
- New Soybean Futures Forecasts
- Additional conversion currencies now available
- New reference endpoint in News API
- Improved GetPriceHistory Excel Add-In functions
For further information please refer to our Release Notes here
March/April 2025
This release of the Fastmarkets Dashboard includes new functionality and features including:
- New – Link to Price Publication Schedule directly through the Fastmarkets Dashboard
- New – Expanded Price Alerts Functionality – ability to set alerts on up to 150 prices
- New – Create a spread on a Price Chart widget – for Fastmarkets pricing
- New – CME Southern Yellow Pine (Fastmarkets) futures – access quotes, trades and settlements on a 10 min delayed basis
- New – Black Mass Short Term Forecast – access pre built market page
For further information please refer to our Release Notes here
February 2025
This release of the Fastmarkets Dashboard includes new functionality and features including:
- New – COMEX Spodumene and Chicago No1 Busheling Futures – access quotes and trades pricing information on a 10 min delayed basis
- New – Prebuilt Market Pages and Newletters launched for Global Pulp, Global Nonwovens and Tissue
For further information please refer to our Release Notes here
November 2024
This release of the Fastmarkets Dashboard includes new functionality and features including:
- New – SAF Balance Sheets
- New – Fastmarkets/USDA Barley Balance Sheet Comparison
- New – Fastmarkets/USDA Soybean Balance Sheet Comparison
For further information please refer to our Release Notes here
October 2024
This release of the Fastmarkets Dashboard includes new functionality and features including:
- New – Get Started – new onboarding experience
- New – Feed Grains Fundamentals Forecasts – new corn future forecasts
- New – Fastmarkets/USDA Corn Balance Sheet – key corn market data
- New – Corn Fundamental Charts – key market data for corn industry
- New – Global Corrugated Converter Database – new feature on global corrugated facilities, providing detailed information on products, capacities, equipment and more
For further information please refer to our Release Notes here
September 2024
This release of the Fastmarkets Dashboard includes new functionality and features including:
- New – Energy Storage Systems Outlook available in the Dashboard Newsletters & Reports
- New – Battery Raw Materials Fundamentals – Batter Cost Index charts available as a prebuild Market Page
- New – Battery Raw Materials Fundamentals – Gigafactory Capacity Database available as a prebuild Market Page
- New – Month-to-date averages (MTD AVGs) for Fastmarket prices now available in the Dashboard
- Improvement – Exporting from Dashboard widgets by sorted order of ‘assessment date’ now available
For further information please refer to our Release Notes here
August 2024
This release of the Fastmarkets Dashboard includes new functionality and features including:
- New – Export forecast prices from Price Chart widget to Excel add-in
- New – Introducing “forward curves” to the Price Chart and Multi Price Table
Improvements to the Dashboard screen
- Change – login screen improvements
- New functionality – Easily add new widget from any Marketpages to your Workspace
- Change – More prominent Scroll bars in the Dashboard
- New functionality – Maximise widget to whole screen
For further information please refer to our Release Notes here
July 2024
This release of the Fastmarkets Dashboard includes new functionality and features including:
- New – CME Comex Lithium Carbonate CIF CJK (Fastmarkets) and Cobalt Hydroxide CIF China (Fastmarkets) futures – access quotes and trades pricing information on a 10 min delayed basis
For further information please refer to our Release Notes here
March 2024
This release of the Fastmarkets Dashboard includes new functionality and features including:
- New – Scrap Settlement Newsletter/pdf now available in the Dashboard Newsletter Center – the latest and past issues from January 2024 are available for download and it is possible to subscribe to email alerts when the next issue is available
- New – download data from the Data Report widget to a PDF or Excel file
- New – view USDA Slaughter data for cattle, calves, hogs and sheep – available to Jacobsen clients
- New – CBOT Agriculture futures – access quotes and trades pricing information on a 10 min delayed basis
- New – CME Lumber futures – see quotes and trades on a 10 min delayed or live basis
- Updated – Various price backfills updated for exchange data, including CME Term SOFR, LME Official backfill prior to 2015 and Platinum and Palladium Close Bid and Close Bid London backfill
For further information please refer to our Release Notes here
January 2024
This release of the Fastmarkets Dashboard includes new functionality and features including:
- New – Remember Me functionality for the Dashboard, mobile apps and Excel Add-in – full Remember Me login functionality replaces former Remember email, providing the ability to remain logged in for 30 days.
- New – Ferro-Alloys Short-term Forecast Tracker in the Dashboard Reports Library – analysis on key developments, trends and data as well as forecasts out to the next year covering Ferro-manganese, Ferro-silicon, Silicon metal, Silicon-manganese, Nickel, Ferro-chrome, Vanadium, Molybdenum plus carbon and specialty steel in pdf format (with email alerts for new issues) supporting the existing digital experience within the Market Pages.
- New – Launch of new short-term forecast prices in the Steel & Scrap Short-term Forecast products
- Changes to Dashboard Market Pages for short-term forecast content – re-organization of the Market Page menu and some names for short-term forecast Market Pages, including the launch of new pages.
For further information please refer to our Release Notes here
| Month | Release Document |
|---|---|
| June 2025 | Download |
| May 2025 | Download |
| March/April 2025 | Download |
| February 2025 | Download |
| November 2024 | Download |
| October 2024 | Download |
| September 2024 | Download |
| August 2024 | Download |
| July 2024 | Download |
| March 2024 | Download |
| January 2024 | Download |
| December 2023 | Download |
| November 2023 | Download |
| October 2023 | Download |
| August 2023 | Download |
| July 2023 | Download |
| June 2023 | Download |
| May 2023 | Download |
| April 2023 | Download |
| March 2023 | Download |
| February 2023 | Download |
| January 2023 | Download |
| December 2022 | Download |
| October 2022 | Download |
| June 2022 | Download |
| January 2022 | Download |
| July 2021 | Download |
| March 2021 | Download |
| December 2020 | Download |
| October 2020 | Download |
| August 2020 | Download |
| May 2020 | Download |
| January 2020 | Download |
| December 2019 | Download |
| November 2019 | Download |
Installing the dashboard
The Fastmarkets Dashboard is available via web browser and as a desktop application.If your operating system is Windows 10 we recommend using the desktop application. If your operating system is earlier than Windows 10 or you prefer to use the Dashboard via a web browser it is recommended to use the latest version of Chrome.
How to install the desktop application:
- Download the Dashboard installer at https://www.fastmarkets.com/platform/support/download-dashboard
- Click the Download button, open the installer file and follow the instructions from your installer
- Accept terms and conditions
- Install on desktop, you may wish to pin the icon to your taskbar
- Log-in with your username and password. You can tick the Remember Me box to save time remembering your email and password. This will enable you to remain logged in for 30 days. If you do not select the Remember Me check box you will be logged out after 2 hours if you have not actively used the application.
Logging into the web version of the Dashboard
The Dashboard can be accessed via web browser from the following URL. It is recommended to use the latest version of Chrome: https://dashboard.fastmarkets.com/
View the Dashboard in Chinese
You have the option to view the Dashboard in Chinese. On the login screen, select your language preference (English or Chinese) to determine the language used in the Dashboard. This selection will default to the language of your browser.
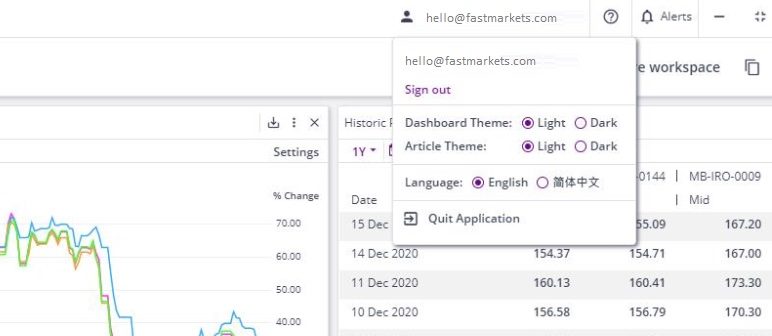
You can change your language preference at any time by clicking on your user name in the top right-hand corner of the Dashboard and clicking on the English or Chinese option selection.
Please note instructional buttons, the Search tool and any displayed dates will be translated into Chinese, however, not all elements of pricing, descriptions, newsletters or news articles are translated.
Customize your workspaces
Workspaces are blank canvases on which you will add tools to track the prices and markets that are vital to your business. You can save and pin your favorite workspaces or you can use the market page templates already available to you. It is also possible to share workspaces with other Dashboard users.
Workspaces are saved automatically whenever a change is made.
To create and customize a new workspace:
- Click Add New Workspace in the top left menu – you may create and save up to 64 workspaces; they will appear on the left side of the Dashboard. To view all your workspaces, click the +More button at the bottom of the workspace list in the sidebar. All workspaces will be displayed as a list. It is then possible to scroll down using the scrollbar. At the bottom of the list the Show Less button collapses the list and only the top 7 workspaces are displayed.
- Click Add Widget and select the widgets of your choice, you can repeat this by adding up to 32 widgets to each workspace.
- Workspace layouts have a fixed grid structure; widgets can be resized by clicking and dragging their edges or corners.
- Widgets can be copied from Market Pages or moved from one customized workspace to another. Click on the widget actions menu and select “Copy widget to” or “Move widget to” and either select an existing workspace or create a new workspace. To retain the widget in the original workspace select Duplicate widget and then copy or move it.
- The color theme of the Dashboard can be amended from Dark (default) to Light for the entire Dashboard or just for news articles according to your preference. Click on your user name in the top right of the Dashboard and select the Dashboard theme or Article theme colors:
 Sharing workspaces and news articles
Users can share a copy of workspaces or news articles with other Dashboard users through email or message by clicking on the Share Workspace icon in the top right corner. This functionality will save time where multiple users require a similar workspace set up, quickly replicate and amend your own workspaces, or share news content with colleagues.
- Click on the Share Workspaces icon in the top right corner
- Copy the URL* and paste it to email or messaging applications. Any changes made to the workspace after the link is generated will not be shared
*The URL link will expire in 30 days - Note – news article URLs can only be shared from the Dashboard web version
View the Dashboard in Chinese
You have the option to view the Dashboard in Chinese. On the login screen, select your language preference (English or Chinese) to determine the language used in the Dashboard. This selection will default to the language of your browser.
You can change your language preference at any time by clicking on your user name in the top right-hand corner of the Dashboard and clicking on the English or Chinese option selection.
Please note instructional buttons, the Search tool and any displayed dates will be translated into Chinese, however, not all elements of pricing or descriptions or news articles are translated.
For more information download a short User Guide here
Book a session with our team to customize your Dashboard
Getting started
The Dashboard, available via web browser or as a desktop application, provides the ultimate flexibility in accessing, comparing and monitoring Fastmarkets Metals & Mining prices and news in an easy-to-use, screen-based solution.
When logging in for the first time, you will see a welcome message offering a brief explanation of the Dashboard.
Navigating the Dashboard
The Dashboard allows you to customize how you view prices, charts, tables and news by using the following:
- Workspaces – Blank canvases on which you will add tools to track the prices and markets that are vital to your business. You can save and pin your favorite workspaces or you can use the market page templates already available to you. It is also possible to share workspaces with other Dashboard users.
- Widgets – These are the tools you add to your workspaces to customize the way you view prices and news.
- Search – Search is available across all widgets and within widgets. You can search using predefined modifiers such as Product, Commodity, Source and Location or you can perform simple text searches.
The screenshot below shows where to find the following Dashboard features.
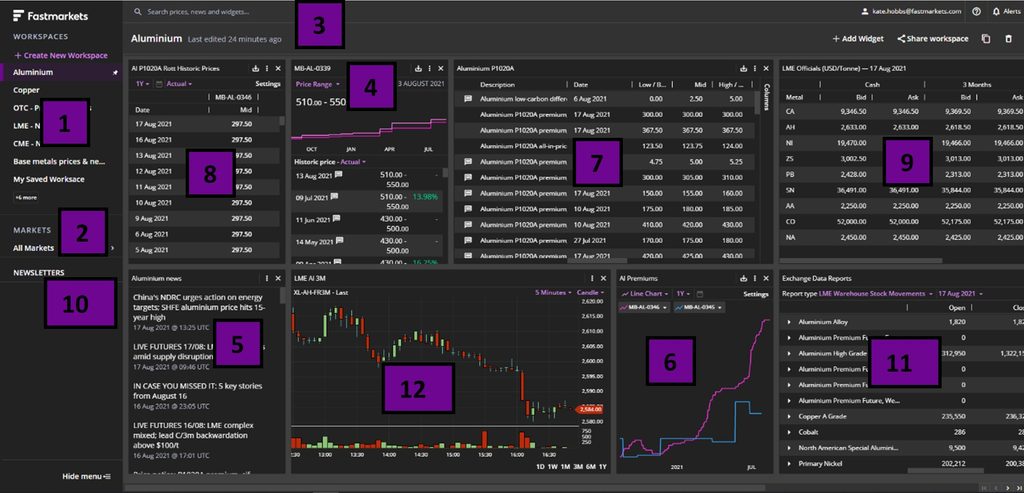
- Saved workspaces – Create and save up to 64 workspaces appearing in the left navigation menu.
- Market Pages – Pre-populated workspaces by market area; use them as starting points to edit and save alongside your existing workspaces.
- Search – Find prices and news by keyword, commodity, location, source and news article type, then select the appropriate widget and workspace to display chosen content.
- Single Price Tile widget – Provides a snapshot of actual assessments or average pricing, along with a one-year view in a sparkline chart and data table.
- News List widget – Filter by article type, commodity, product, location and source.
- Price Chart widget – View historical pricing in graphic or tabular format for up to eight prices for chosen dates; compare price fields for actual assessments; perform relative comparison with a percent-change chart
- Multi Price Table widget – View up to 100 prices with customizable rows and columns.
- Historic Price Table widget – View historical data for up to 20 prices with customizable date-range selection.
- Pre-Configured widgets – View a selection of prices from the London Metal Exchange (LME), the Shanghai Futures Exchange (SHFE) and the CME Group. Learn more about these capabilities in the “Widgets” section of this manual.
- Newsletters – Create curated price and news content in the form of a pdf newsletter.
- Report widget – View a selection of pre-configured reports from the London Metal Exchange (LME) including LME Warehouse Stocks, LME Averages and LME Closing Prices.
- Live Chart widget – View historical data for exchange and OTC pricing with open/high/low/close prices in a line, bar, candle or mountain chart type
Dashboard Icon Functions
![]()
- Add widget to a workspace
- Share the link of workspaces
- Duplicate a workspace
- Delete a workspace
- Price and News alerts
- User information and Dashboard color theme and language preferences meu
- Help and feedback menu:
- Legal information – terms & conditions, privacy policy etc
- Send feedback
- View Walkthrough – Dashboard features
- Support – access the Support website with user guides and help videos
- Methodology – access price methodology, pricing notices, holiday calendar and more
- Price packages – further information about Fastmarkets pricing
You can watch a short video to get started here
To get started you may wish to begin with one of our pre-built Market pages. Take a look at the Market Pages section on this page.
Market pages
Our market pages are pre-built to include the key prices and information that our expert editorial team have identified giving you an overview of the market at your fingertips. Covering commodity areas and key product or industry areas, these market pages are available in line with your subscription.
Market pages are pre-populated workspaces by market area; use them as starting points to edit and save alongside your existing workspaces.
How to view market pages:
- Go into your Dashboard
- Click on All Markets on the left-hand menu
- Market pages are grouped into Core market pages, End-use markets and Specialized commodities sections.
- Explore content
- Pin favorite Market Pages so they remain in the left-hand menu by hovering your mouse to the right side of the Market Page name in the menu and then click on the pin icon
- To further customize a Market Page, click the Add to workspaces button in the top right-hand menu to save the workspace to your Dashboard and begin to edit it further
- Alternatively, copy individual widgets from a Market Page to your own workspace by selecting the 3 dots in the top corner of the widget, select Copy widget to and select your workspace
Please note – market pages are dependent on your level of access.
For more details on using and customizing market pages, please refer to this short User Guide.
Searching and saving prices, stocks and inventories
Our search tool helps you find prices by keyword, commodity, location and source, then select the appropriate widget and workspace to display chosen content.
The search tool, which can be found at the top of the Dashboard or within widgets, can be used to find prices and news articles by using keyword searches or filters. Prices and news are tagged to pre-defined categories, ensuring relevant content can be found easily. Please refer to the News section for further detail on searching for articles.
How to use the search for prices:
- Start a search by clicking on the magnify glass icon in the top menu and begin your search
- Enter a search term (e.g. “aluminium”) for the price you are looking for – you can search by and select using the product, commodity, location or source filters which appear as you type
- Select the PRICES tab above the right-hand side results options to filter by prices only
- Select the result you were looking for from the suggested options in the drop down menu to populate a list of prices
- You can narrow down the list of prices by entering an additional search filters and selecting it from the drop down, e.g. “Location:Rotterdam”
- Select the price you wish to display, you can click on the purple star next to the price to retain it as a favorite in the search for future use
- Select the type of widget you want to add to your workspace to – select from a Single Price Tile, Price Chart, Historic Price Table or Multi Price Table widget
- Select the workspace you want to add it to.
- Click Add Widget
Please note: Any prices that are not included in your subscription will not appear in the search results.
Data reports widget – discover LME data, bonded stocks and inventories:
Fastmarkets base metals bonded stocks, chrome ore and manganese ore inventories can be accessed via the Add Widget button using the Data reports widget. These data sets require the following subscriptions:
· Base metals bonded stocks – base metals prices included in their subscription
· Chrome ore and manganese ore inventories – ores and alloys prices included in their subscription.
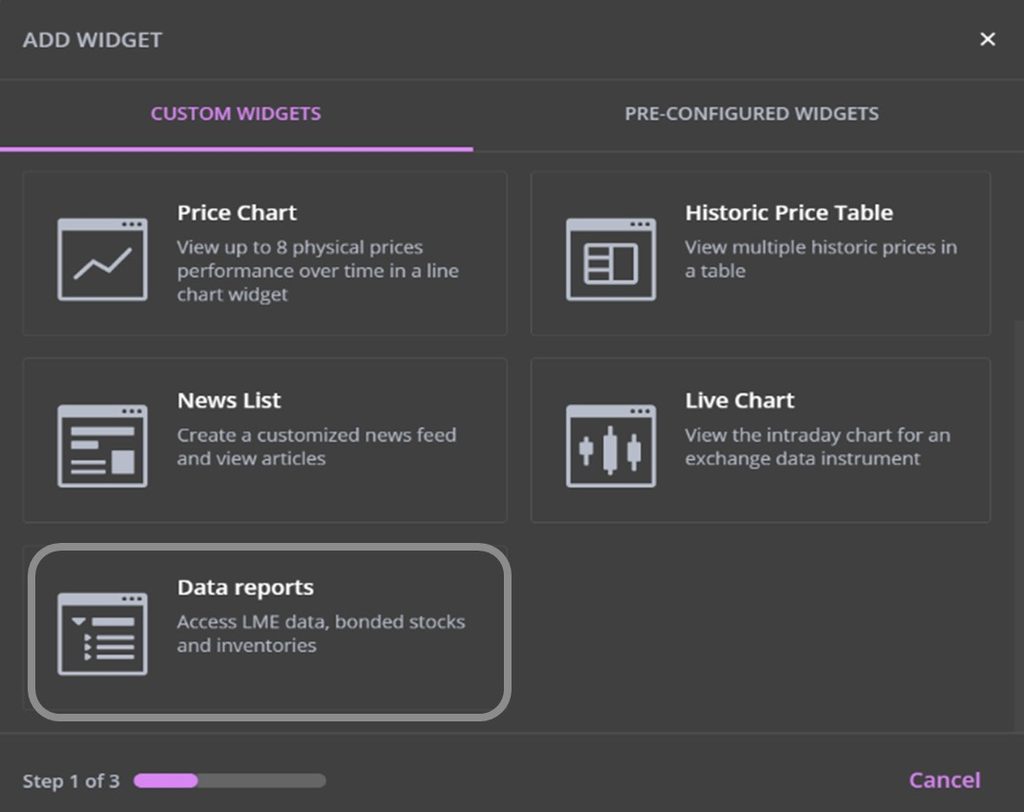
- Start by clicking on the Add Widget icon in the top menu or the middle of a new workspace
- Select Data Reports (this previously was named Exchange data reports) in the ADD WIDGET selection box
- Choose from an existing workspace or create a new workspace to add the widget to
- Select the stocks or inventory data you wish to view from the Report type dropdown menu to view the data
 You can also choose to display historical data by selecting from the date menu. The latest available data will be displayed for your chosen date. These data sets update with the following schedule:
· Copper bonded stocks – every other Monday
· Aluminium, nickel and zinc bonded stocks – monthly
· Chrome and manganese ore inventories are weekly, every Monday
The available dates will be highlighted in white.
Note: The Data reports widget also contains LME content sets such as LME Closing Prices, LME Warehouse Stocks and LME Averages. To find out more about these please refer to the Exchange market data User Guide.
For more details on how to search in the Dashboard please refer to this short User Guide.
Comparing prices
Track the latest market data and monitor market changes, price relationships and volatility across a range of minerals with our Multi Price Table widget.
Display up to 150 prices to compare the prices that you need. Customize the data fields that are displayed to ensure you are viewing the price data you need as you need it.
Using the Multi Price Table widget:
- Click Add Widget from the top menu
- Select Multi Price Table widget
- Search for prices using our search assist
- Select the workspace you want to add the widget to and click Confirm
- Click on the Columns menu on the right-hand side of the widget to select the data fields you want, some frequently used fields such as Description, Low, Mid, High, Assessment Date, Monthly Average and Monthly Average period are already populated. This menu will adjust depending on the type of price (physical assessment vs exchange market data or over-the-counter) that is added to the widget
- Click on the column headings to sort by that field
- Or hover over the left-hand side of the row until two lines (‖) appear then drag to arrange the rows
- Hover over the column headings until two lines (‖) appear to arrange the column as needed
From time to time Fastmarkets may adjust prices contained in the price packages by launching new or discontinuing prices. Once a pricing notice has been issued and the price is discontinued it will remain available in the Dashboard for up to two years before being removed. During this period, you will see the following icon (calendar with an “x”) and row highlighting in the Multi Price Table to denote it has been discontinued:![]()
When no longer available in the Dashboard you will see this message: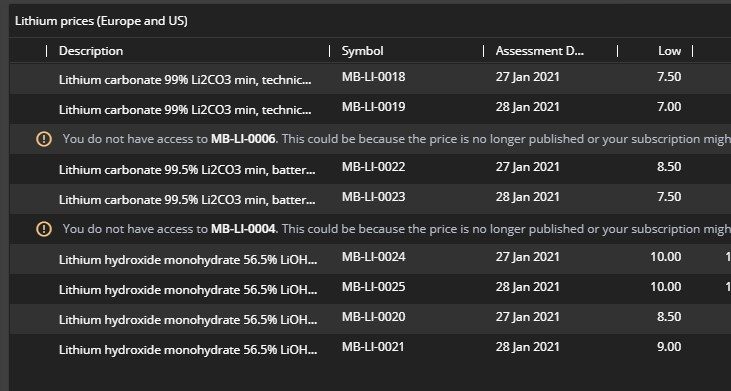
To access Fastmarkets Pricing Notices please click here – https://www.fastmarkets.com/about-us/methodology/price-notices
Accessing Pricing rationales
Pricing rationales are short pieces of text to explain how the price was derived and how any assessment was developed. It provides increased transparency, explaining how and why expert judgment was exercised, and is provided for all our IOSCO audited prices.
Pricing rationales are published on select prices via the single price widget and the multi price table on the dashboard. Please note: pricing rationales are not available for all prices and requires a price packages subscription.
- If a price has a pricing rationale in a widget, a small speech bubble icon is displayed next to the price. You may need to hover over the price to be able to see it. The icon is available only in “Actual” mode, “Averages” don’t have pricing rationales
- Click on the icon and the pricing rationale will be displayed
- To return to the prices, click Back at the top of the widget.
For more information please download a short User Guide.
Fastmarkets published average prices
Fastmarkets publishes weekly, monthly, quarterly and yearly averages based on the underlying actual assessments. For certain Cobalt prices there are also Weighted Average of Trades (MB-CO-0004 and MB-CO-0005). The averages are published on the first day of the next average period for the previous average, e.g., for a monthly average published on 1st June it will display the May monthly average.
Fastmarkets Averages methodology:
Fastmarkets averages are a simple average calculation. Fastmarkets’ simple monthly averages are calculated by dividing the sum of all price quotations within a month by the number of quotations published during the calendar month. For assessments, Fastmarkets derives both the monthly average high price and the monthly average low price using this method. For indices, a single monthly average price point is calculated.
The following assessments are published on a simple average methodology:
· All base metals, including calculated prices
· All nonferrous scrap, including calculated prices
· All steel
· Ferrous scrap, including regional domestic assessments – such as Chicago, Detroit, etc. – and export yard prices, the export indices, Mexican scrap prices and the Midwest scrap indices
Fastmarkets averages for calculated composite prices for ferrous scrap are the exception to the above. These are calculated using a rolling average methodology by dividing the sum of the daily price quotations – including prices republished on non-assessment days – by the number of quotations published during the calendar month.
In a rolling-average scenario, prices are published daily, regardless of how frequently they are updated. Daily price quotations are rolled over on working days until the following price change, excluding holidays and weekends. No pricing inputs are published on holidays or weekends.
Effective March 1st 2023, Fastmarkets made a change to the calculation of mid-prices for published averages.
To align with market convention, Fastmarkets will change the calculation of averages to represent the monthly average of the midpoint of each pricing session during the month.
Currently, the average function, when used for assessments, calculates the midpoint of the monthly average high assessment and monthly average low assessment.
Although the new average calculation may result in a difference of +/- 0.01 when calculating averages to two decimal places, it will typically be no higher or lower. No averages will be retrospectively changed.
You can read more about this change here – https://www.fastmarkets.com/insights/conclusion-of-open-consultation-on-calculation-of-averages-on-the-fastmarkets-platform
Month-to-date averages
Fastmarkets’ month-to-date averages are calculated by dividing the sum of all price quotations by the number of quotations that have been published within a calendar month at the time of access/prior to the publication of the official monthly average.
Fastmarkets makes available the month-to-date average after the publication of the first price quotation in that calendar month. The month-to-date average figure will be recalculated and updated automatically after each price quotation publication. Once the official monthly average is published, the month-to-date average will no longer be visible.
These can be found in the Single Price Tile, Multi Price Table and Historic Price Table widgets
You can find out more about how to find and display Fastmarkets published averages here
News
Save time searching, filtering or repeating news searches on key topics or markets with our News List widget. Understand the markets that matter to you by creating a customized news feed, multiple saved searches to display alongside prices and charts.
Using the News widget:
- Click Add Widget from the top menu
- Select News List widget
- Choose from Recommended news lists e.g. Base Metals, Steel or Steel scrap or
- Use the search bar for the commodity, location, product or source you want to filter by with our search assist
- Select the workspace you want to add the widget to from the left-hand sidebar.
How to search for news:
- Start a search by clicking on the magnifying glass icon in the top menu and begin your search
- Enter a search term (e.g. “copper”) for the news you are looking for – like with price searches you can search and filter by product, commodity, location or source. Search filters appear in the Filters applied bar in a grey box.
- Select the result such as “Commodity:Copper” you were looking for from the suggested options in the drop-down menu to populate a list of news content
- You can further narrow down the list of news by entering any additional search filters and selecting it from the drop-down, e.g. “Location:China“. Click the ARTICLES tab to view the results.
- When you hover the cursor over any article in the list the “Launch article” icon is displayed. This icon looks like a purple square with an arrow pointing to the top-right corner.
- Click on the “Launch article” icon to open the article in a floating window.
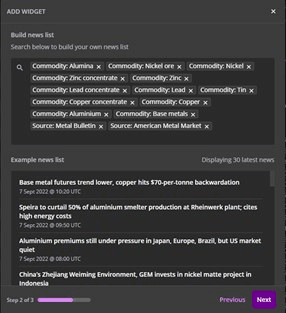
Search for news using pre-populated search filters
When adding a News List widget the Search Tool will provide easy to use pre-populated search criteria making it faster to find the news for the markets you follow. In this example Base metals has been selected, adding relevant filters: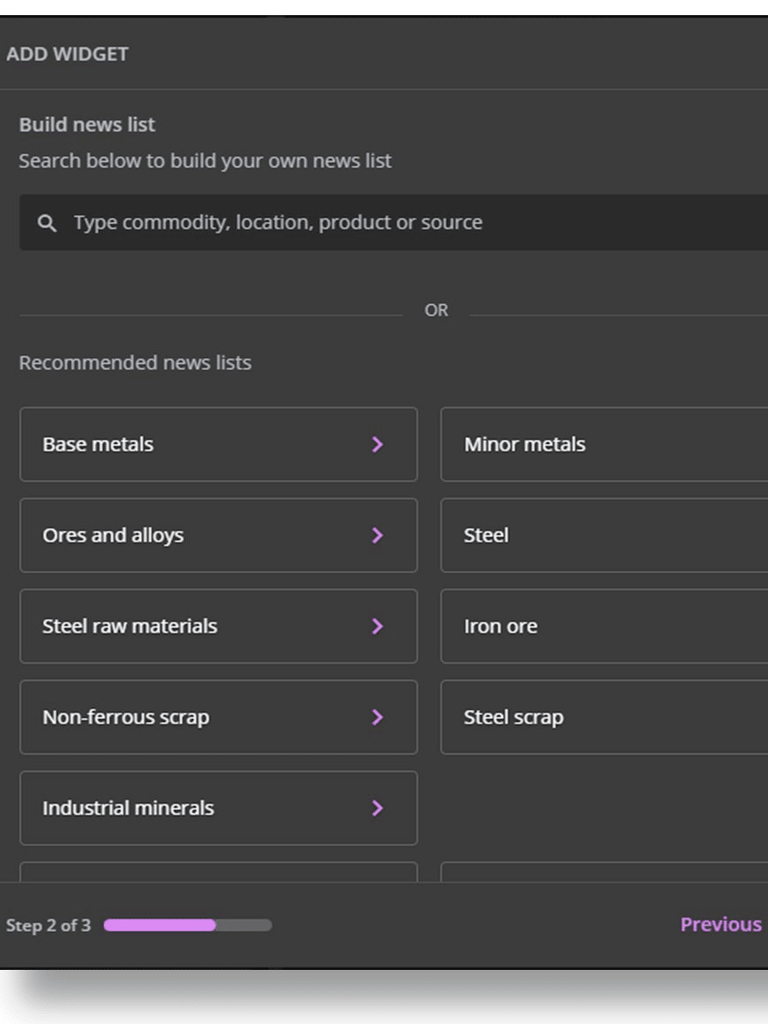
 Search by keyword(s) for news: Searching by keyword(s) will return results for stories with the word(s) in the headline or body text of an article. Click on the ALL tab for price and news results. Click PRICES or ARTICLES to view results returned specifically under those tabs.
- Start a search by clicking on the magnifying glass icon in the top menu and begin your search
- Enter your keyword search term (e.g. freeport mcmoran). Keywords appear at the top of the criteria with a purple border.
- Click the ARTICLES tab to view a list of news articles where this keyword appears
- Click the “Launch article” icon to the right of the headline to view the news article.
Filter news search results by date and/or relevancy: Use the Global Search tool at the top of the Dashboard to save time finding news articles by using the date filter:
- Start a search by clicking on the magnifying glass icon in the top menu and begin your search
- Enter a search term (e.g. “base metals”) for the news you are looking for – like with price searches you can search and filter by product, commodity, location or source
- Select the result you were looking for from the suggested options in the drop-down menu to populate a list of news content
- Click the ARTICLES tab to view a list of news articles where this keyword appears
- By default, the search results will be returned with the most recent appearing at the top. This can be changed to most relevant by selecting ‘Most relevant first’ from the Show menu above.
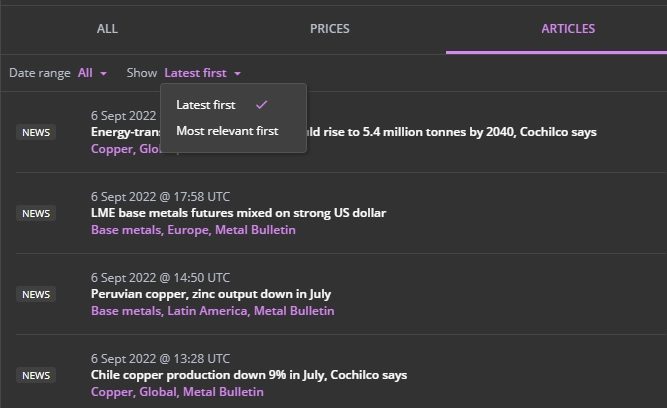 By default, the date range for the news search results is ‘All’. To narrow the search results by date, select from the Date range menu above the search results. The available date range selections are the last 24 hours, last week, last month, last 6 months or last year.
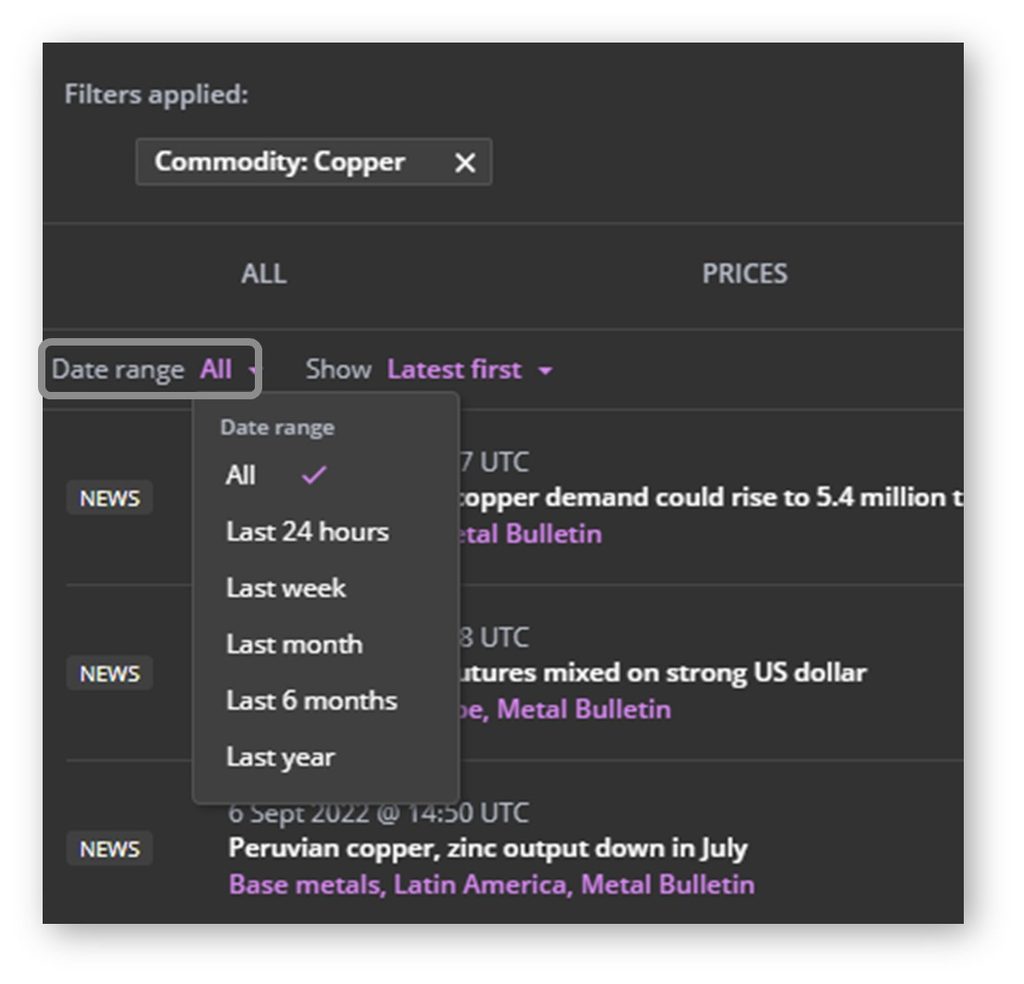 For more information please download a short USER GUIDE.
Exporting
Data or images may be printed, exported and copied for use in spreadsheets, reports and presentations (as aligned with the terms and conditions of your Fastmarkets data license agreement).
Copying data for the Excel Add-in requires you to first install and login to the Excel Add-in on Microsoft Excel.
The Excel Add-in can be downloaded and installed here: https://www.fastmarkets.com/our-platform/support/excel-add-in-support/excel-download
Further information, help and templates can be found here: https://www.fastmarkets.com/platform/support/excel-add-in
The export icon can be found in the top-right corner of each widget. Menu options are the same for the Price Tile and Multi Price Table widgets.
Copy or export data from Single Price Tile, Multi Price Table or Historic Price Table widgets
You can copy or export selected prices from the Single Price Tile, Multi Price Table or Historic Price Table widgets based on the fields selected in the widgets. An image of the price displayed in the widgets can also be exported in a PDF format. Any physical prices which have been converted to a different currency and/or unit of measure within a widget will be exported in the selected conversions rather than it’s assessed currency and/or unit of measure.
In a Single Price Tile widget, historical data for the displayed fields and prices can be exported in the following formats:
– Copy for Excel Add-in (Excel Add-in required to copy formulae)
– Copy values only (static data)
– Export – Comma-separated values (.csv; file saved to Downloads folder)
– Export – Microsoft Excel (.xlsx)
Here is a look at the Excel and PDF results in greater detail.
- Copy for Excel Add-in
- From a Single Price Tile widget, historical data for the displayed data fields (high/low or midpoint for actual assessments or averages, for instance) is copied. When the prices are pasted into the Excel Add-In it will use the GetPriceHistory function, creating formulae enabling the data to update with the latest published price history when the spreadsheet is refreshed.The Multi Price Table widget will enable the entire table of data to be copied, not just what is in view in the widget (if the table includes a longer list of prices).Please note it is not yet possible to export exchange prices to the Excel Add-in. Please use “Copy values only” instead .
- Copy values only
- This will provide a copy of static price data from your Single Price tile, Multi Price Table or Historic Price Table widget – it will not update in Excel once a new assessment is published.
- Exporting – comma-separated values (.csv) and Microsoft Excel (.xlsx)
- Exporting data to a .csv or .xlsx file format will automatically save the file in the local Downloads folder. The filename will include the date and timestamp from when the data was downloaded. Please note: This is an export of static data – it will not update once a new assessment is published.
- Exporting – PDF Document (.pdf) From a Single Price Tile this will provide an image of current view which includes the spark line chart, reference data, latest actual and monthly average price for the selected price and pricing rationale (if available). From a Multi Price Table it will export symbol, description, assessment date, price, net change and monthly average data. From a Historic Price Table widget the first six prices will be exported exactly as displayed in the widget (depending on field selection).
Copy or Export data from a Price Chart widget
You can export or copy data and images from a Price Chart widget in the formats below.
Historical data will be exported for the date selected at the top of the chart and will include all prices and field labels displayed (up to eight prices with high/mid/low would export 24 columns of data).
– Copy for Excel Add-in (Excel Add-in required to copy formulae
– Copy values only (static data)
– Export – comma-separated values (.csv; file saved to Downloads folder)
– Export – Microsoft Excel (.xlsx)
– Export – PNG image (.png; exports current view)
– Export – PDF document (.pdf; exports current view)
All image export files can be found in your local Downloads folder, labeled with the date and timestamp of export.
Exported image files contain the price symbol, price description and field names, username of the person who has exported the chart, download date and time, and the Fastmarkets watermark and data license agreement message.
Print or Export data from a News List widget
News articles can be exported and printed for use outside of the Dashboard.
- Click Launch Article
- Click Print Article in the top-right to export into pdf format and print.
- The article will have a white background and show the name of the user who exported it, with the date and timestamp.
For more information please download a short User Guide.
Alerts
To stay abreast of changes in prices and news, you can create alerts for a single price, multiple prices or news within the Fastmarkets Dashboard. Notifications will be delivered in the Dashboard when the application is open and running.
How to set up alerts for a single price:
- Click Alerts in the top-right corner
- Click Create New Alert
- Select Single Price Alert
- Use the search tool to select the price you want to create and alert for or select the price from Saved Prices and click Next
- Select the type of price alert you wish to create:
Assessment Published Alert – notifies you when a new assessment has been published
Price Change Alert – notifies you when the price changes from the previous assessment
Advanced Alert – notifies you when the price field reaches the following criteria:
– Low/Mid/High goes above or below a specified price
– Low/Mid/High increases or decreases by a specified absolute value
– Low/Mid/High increases or decreases by a percentage value - Select the Delivery Method for your alert – either in the Dashboard or by email.
- Enter a name for your alert in the Alert name field or use the default name provided.
- Click Confirm to save and activate your alert
- When an alert is triggered the Alerts icon will display a purple circle with the number of alerts that have been triggered
- Click on the Alerts button to view the alerts in the drop-down list.
How to set up alerts for multiple prices:
You can create alerts for a group of prices of a similar Commodity, Price or Location by using the search filters. The following will trigger an alert if a single price within the group changes, depending on the selected type and criteria.
- Click Alerts in the top-right corner
- Click Create New Alert
- Select Price Group Alert
- Use the search tool to select the price group you want to create an alert for and click Next
- Select the type of price alert you wish to create:
Assessment Published Alert – notifies you when a new assessment has been published
Price Change Alert – notifies you when the price changes from the previous assessmentAdvanced Alert – notifies you when the price field reaches the following criteria:
– Low/Mid/High goes above or below a specified price
– Low/Mid/High increases or decreases by a specified absolute value
– Low/Mid/High increases or decreases by a percentage value - Select the Delivery Method for your alert – either in the Dashboard or by email. For email delivery select to Combine into a single email and choose the frequency from the purple drop down (once a day or a specific weekday) and enter the chosen time for your time zone or Every time a matching price is published for individual alerts.
- Enter a name for your alert in the Alert name field or use the default name provided.
- Click Confirm to save and activate your alert
- When an alert is triggered the Alerts icon will display a purple circle with the number of alerts that have been triggered if you have selected to be alerted in the Dashboard, otherwise you will receive an email with the latest price assessment and a link to open the article in the Dashboard. Batched email alerts will include monthly average prices.
- Click on the Alerts button to view the alerts in the drop-down list.
How to create news alerts:
- Click Alerts in the top-right corner
- Click Create New Alert
- Select News Alert
- Use the search tool to select the criteria you want to create your news alert for
(e.g. selecting both the search criteria “China” and “Carbon steel” will set up alerts for every news article that is published that is tagged as both “China” and “Carbon steel”, but will not create an alert for articles published that are only tagged for one of the search criteria). Click Next - Select the Delivery Method for your alert – either in the Dashboard or by email. For email delivery select to receive Once per day showing all matching articles at and enter the chosen time for your time zone or Every time a matching article is published for individual alerts.
- Enter a name for your news alert in the Alert name field or use the default name provided.
- Click Confirm to save and activate your alert
- When an alert is triggered the Alerts icon will display a purple circle with the number of alerts that have been triggered
- Click on the Alerts button to view the alerts in the drop-down list.
How to view triggered alerts:
The Alerts icon will display in a purple circle the number of alerts that have been triggered. When the Alerts menu is opened the triggered alerts appear with a purple dot next to them. When the Alerts menu is closed, the triggered alert icon will disappear.
How to edit an alert:
- Click Alerts in the top-right corner
- Click Manage Alerts and a list of your alerts will appear in the drop-down menu
- Hover the cursor above the alert you wish to edit and click on the pencil icon that appears to the right of it.
- The EDIT ALERT window will open. Make the necessary changes to the alert and click Confirm to save.
Please note it is not possible to edit any alerts set up prior the release of v1.65.7155 on 1st March 2021
How to delete an alert:
- Click Alerts in the top-right corner
- Click Manage Alerts and a list of your alerts will appear in the drop-down menu
- Hover the cursor above the alert you wish to delete and click on the X that appears to the right of it.
For more information please download a short User Guide.
Charts
The Dashboard provides two different types of charting tools. The first is the Price Chart widget enabling you to identify trends, compare prices over time or gain a view of where to forecast prices graphically for prices with a high/low/mid value or bid/ask/mid. View historical pricing as a line chart for up to eight prices for a chosen date range; compare price fields; view absolute prices, or compare prices with a percent change chart.
The second is the Live Chart widget which enables you to view historical and intra-day data for a single exchange or over-the-counter (OTC) price (such as spot precious metals or foreign exchange (FX) rates) plotting open/high/low/close prices. Select either a line, bar, candle or mountain chart for one price, displaying the data in intervals from 5 minutes up to 1 month with volume data (where available) in the sub-chart at the bottom.
How to add the Price Chart:
- Click Add Widget
- Click the Price Chart widget button
- Search for and select the prices you wish to chart, selecting up to eight prices. Then click Next.
- Choose the workspace to which you want to attach the Price Chart widget, then click confirm
- By default, the chart will plot both high and low prices (if available) and display the last year of data.
- The price symbol is displayed in the legend above the chart. Clicking the arrow next to the symbol will allow you to chart averages, amend the color scheme or hide and show each price line chart.
- To view the full description of the price, hover the mouse over each symbol in the legend.
- You can switch between a data table and the chart view from the Line Chart menu in the top left corner.
Edit the date range of a chart:
By default, one year of historical pricing is displayed, but the date range can be customized in three ways:
- Select from the pre-configured time-periods menu at the bottom of the chart or customize the time period by using the calendar to select a start date and an end date.
- Select a time period using the range slider in the sub-chart
- Left-click to drag the highlighter at each end to cover the time period you wish to view and click Apply
- The dates and price lines in the chart will adjust accordingly
- You can view prices for a specific date by hovering your cursor over the lines in the chart. A display showing the date and prices will appear with a vertical line as the cursor moves over the price lines.
Edit the displayed price fields:
It is possible to display the high, low or midpoint of a price range or a combination of these price fields
- Click the Settings panel in the top-right of the chart
- Select the radio buttons to select the fields you wish to display.
- Maximize screen space by toggling the “Show legend“, “Show range” slider or Date range presets sliders
Comparing prices in a Price chart
- Search & add up to 8 prices to your chart
- Click on Settings and select from the following:
- Absolute prices (default) displays prices unaligned at their actual price
- Percent change plots prices as a percent change value from one assessment date vs previous starting the selected start date of your chart
- Multiple Axes – plots each price on an individual Y-axis enabling you to overlay and visualize prices together despite different price ranges and scaling.
How to add the Live Chart widget:
- Click Add Widget
- Click the Live Chart widget button
- Search for and select the price you wish to chart (note, you can only add a single price to this widget). For example, to plot the live USD Gold spot rate type “Gold” and select the filter Commodity: Gold and select the Gold US Doller/Troy Ounce – Spot price. Then click Next.
- Choose the workspace to which you want to attach the Live Chart widget, then click Confirm
- By default, the chart will plot both open, high, low and close prices for a selected period.
- The price symbol and field plotted is displayed in the top left of the chart.
- To change the periodicity of the chart, click the dropdown top right. Each candle represents the selected period. Choose from 5 minutes, 1 hour, 1 day, 1 week or 1 month.
- To change the type of chart which is displayed, click the bar type at top right. The options are bar, candle, line and mountain.
- To view, the price data for the period selected, hover the mouse over an interval on the chart. The chart shows a display box with details of the price at that interval.
- To resize the chart move the mouse scroller up to see more data, and down to zoom in on less data. Click and drag the mouse to move forward and backward in time.
For more information please download a short User Guide.
Sharing workspaces and news articles
It is possible to share a copy of workspaces, prices or news articles with other Dashboard users through email or messaging, which will save time where multiple Dashboard users require a similar workspace set up, quickly replicate and amend your own workspaces or to share news content with colleagues.
Sharing workspaces and news articles
- Click on the Share Workspaces icon in the top right corner
- Copy the URL* and paste to email or messaging applications. Any changes made to the workspace after the link is generated will not be shared.
*The URL link will expire in 30 days.
Note – news article URLs can only be shared from the Dashboard web version.
Sharing prices
Prices can be shared from the Search Tool at the top left of the Dashboard. Enter your search criteria, click on the Prices tab to view the results and select the price you are looking for. Before selecting the workspace and widget to add the price to click on the Share link icon in the bottom left. This will copy the link to your clipboard, allowing you to paste into email or instant messaging applications.
For more information please download a short User Guide.
Exchange data
The dashboard provides the ability to view pricing from the London Metal Exchange (LME), CME Group (CME) and Shanghai Futures Exchange (SHFE) in pre-configured widgets.
– LME Official Prices widget
– LME Unofficial Prices widget
– CME Settlement Prices widget
– SHFE Close Prices widget
How to set up an Exchange Pricing widget:
- Click the Add Widget icon
- Select the Pre-configured Widgets tab
- Select one of the Pre-configured widgets
– LME Official Prices
– LME Unofficial Prices
– CME Settlement Prices
– SHFE Close Prices - Select Confirm to create the widget.
LME Official Prices and LME Unofficial Prices widgets
The LME Official Prices widget and LME Unofficial Prices widget provide an overview of key exchange pricing for the previous day across Cash, 3 Months, 15 Months and the first three December prompt dates for the following contracts:
CA – Copper; AH – Aluminium; NI – Nickel; ZS – Zinc; PB – Lead; SN – Tin; AA – Aluminium Alloys; CO – Cobalt; and NA – Nasaac (North American Special Aluminum Alloy Contract)
CME Settlement Prices widget and SHFE Close Prices widget
The CME Settlement Prices widget displays the previous day settlement prices for the first four CME (formerly COMEX) gold, copper and silver futures contracts.
The SHFE Close Prices widget displays the latest closing prices for the first-month SHFE aluminium, copper, nickel, lead, tin and zinc futures contracts.
How to search and add Exchange pricing to existing widgets It is also possible to search and add Exchange pricing for LME, SHFE and CME into your existing widgets to compare with physical pricing. This is available for Single Price Tile, Multi Price Table, Price Chart and Historic Data table widgets.
- Click into the widget actions menu in the top right of the widget and select Edit widget. This will open the search tool. (In the Single Price Tile widget click Clear at the bottom to remove the existing price).
- The quickest way to search is using the source filter. Click into the search box next to the magnifying glass and select the Source filter.
- Next select the exchange code e.g. Source: LME.
- Narrow your search by typing the commodity in the search box and selecting the filter e.g. Commodity: Copper, you may also wish to enter additional search keywords such as Official or Cash to narrow the search results.
- Click on the + Select button next to your chosen contract in the search results and click Next to add it to the widget.
Please note it is not yet possible to convert currency and/or unit of measure for exchange prices.
Depending on your access you may be entitled to view previous day, delayed or live exchange prices in the Multi Price Table widget. When a price changes in real time, it flashes either green (up tick) or red (down tick) from the previous price update.
View London Metal Exchange (LME) Monthly Averages, Warehouse Stocks and Closing PricesView a selection of pre-configured reports displaying previous day data from the London Metal Exchange (LME) including:
– LME Monthly Averages
– LME Warehouse Stocks
– LME Closing Prices (Evening Evaluations)
To add this data to your workspace:
- Click Add widget > Data Reports and click Confirm.
Once the widget is populated, to amend the type of report click on the purple Report type – select from LME Warehouse Stocks, LME Monthly Averages or LME Closing Prices. - The LME Warehouse stocks report provides previous day detailed warehouse and stock reports which include opening and closing stocks, stock movements, cancelled & live warrants across locations and metals. By default, when the report is selected it displays stock totals across all warehouses per metal. Each metal can then be expanded further to display details for each LME warehouse, then again by type of materials.
- The LME Averages report displays the LME Monthly Average Settlement Price (MASP) which is based on LME Official Cash Settlement Prices available in the month. These averages are published daily, totaled and averaged over the number of business days in the month, resetting at the end of each month. Prices are displayed in US dollars per metric tonne. The MASP is the settlement price for Monthly Average Futures and LME Traded Average Price Options (TAPOs) contracts.
- On the LME Closing Prices report, click on the arrow next to each metal to display closing prices for each prompt date in each of the 4 currencies cleared by the LME.
- To view historic report data, click on the date drop down menu and use the arrows to select the last day for the month and year you wish to view.
Fastmarkets Dashboard also contains:
– Spot precious intraday pricing as well as LBMA prices
– Live global FX spot rates and forwards
– Daily ECB rates
For more information please download a short USER GUIDE
Short-term forecasts
In a time of increased uncertainty critical insight into price forecasts provides the ability to make better informed decisions. Fastmarkets have been providing research analytics for over 30 years and our forecasts are built on a robust methodology which will enable you to plan purchasing or manage inventories; guiding your next decision or negotiation whether you are buying, trading or hedging.
Fastmarkets short-term forecast content in the Dashboard includes:
- Short-term forecast Market Pages – these pre-configured workspaces are a great starting point to discover the forecast prices, commentary and analysis for your subscription.
- Forecast prices in a Price Chart widget – these can be added to your current workspace allowing you to view forecast prices alongside past history in your existing Dashboard charts
- Forecast commentary and research analysis articles – these can be accessed from the Price Chart widget or News List widgets – understand why prices are at current or past levels as well as a view of how they will develop over the coming months.
- Access short-term forecast tracker publications in pdf format with support Excel spreadsheets in the Dashboard Reports Library
Access to short-term forecast content
Access to short-term forecast content is available as an add on to your existing Fastmarkets data license(s). If as a subscriber to our forecast content, the below functionality options do not appear in your chart please contact our Client Services team clientservices@fastmarkets.com to check your level of access.
Forecast methodology
Fastmarkets forecasts prices are published monthly, some forecasts are published on a weekly basis, for the current and following year. Corresponding commentary will update throughout the month as markets move.
You can find more information about the methodology and modelling for Fastmarkets Forecasts here.
Plot forecasts in the Price Chart widget
Price forecasts can be plotted alongside existing Fastmarkets published assessments in a Price Chart widget so you can understand the historic assessment price trend and view the forecasted price direction together in one chart.
Forecasts are available by searching for the “parent” price symbol, no need to search separately. To understand which prices have available forecasts please refer to the Our metals prices section towards the top of this page.
- Click on Add Widget and select Price Chart widget
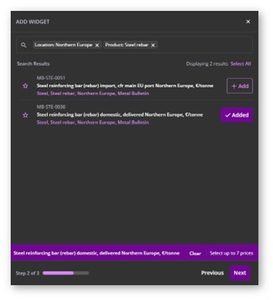
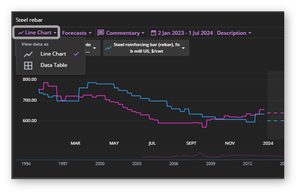
- Search for the “parent” symbol e.g. for Steel reinforcing bar (rebar) domestic, delivered Northern Europe, €/tonne (MB-STE-0036). Begin by typing “Steel rebar” and select the filter Product:Steel rebar and narrow your results down by searching for “Northern Europe” and selecting the location filter
- Click Next, select the workspace to add the widget to and click Confirm
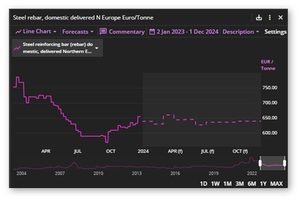
 By default the forecast is displayed to the right of the historical price in the lighter grey shaded area, denoted as a dashed line. , you can easily add the related forecast by toggling on above chart. By default it loads the full forecast series:
Each dashed line in the chart displays a weekly or monthly price forecast data point depending on the frequency of that published forecast.
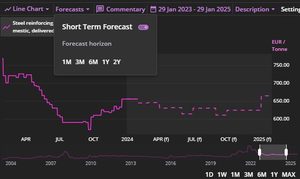
You can toggle forecast prices on/off and edit the time horizon of the plotted forecast prices from the Forecasts menu:
Edit the date range of the price history on the left side of the chart as you usually would in the Price Chart widget. For more information refer to the Charts support section.
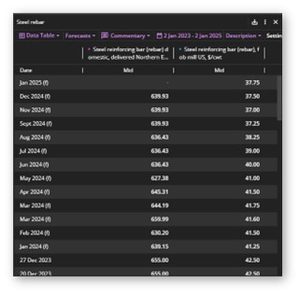
You can switch to a data table of price history and forecast prices by selecting Data Table from the top left menu in the Price Chart widget, switch back by selecting Line Chart:
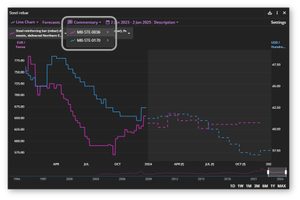
View forecast commentary from a Price Chart widget
Fastmarkets forecasts also provide a commentary or summary which updates during the month giving a view of current factors impacting a price or group of prices.
To navigate from the Price Chart widget to the forecast commentary click on the Commentary menu at the top of the chart and select the symbol you wish to read a commentary for. If you have multiple symbols in the chart those which have a forecast price will have a corresponding commentary available.
Discover forecast market analysis
Fastmarkets commentary and market analysis provides in depth detail how the previous month’s forecasts performed, what changed and why as well as intelligence and analysis from the latest industry events. This in depth market analysis can be found by navigating from the Price Chart widget or through the News List widget.
- Select the Commentary menu, selecting your chosen parent symbol
- Next click on the purple Full article button above the commentary article
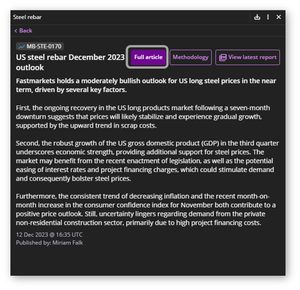 Monthly market analysis provides an in depth outlook for a price or group of prices which may include graphics and data tables.
Access the Short-term Forecast Tracker (pdf) from the Price Chart widget
Fastmarkets full market analysis is available in pdf format in the Dashboard Reports Library. You can easily navigate from the Price Chart widget by clicking on the View latest report button in the Outlook Commentary or Analysis articles as is show below:
![]()
![]()
This will direct you to the Dashboard Reports Library where you can find all Tracker publications within your subscription.
Access short-term forecast tracker documents in the Dashboard Reports Library
The Dashboard Reports Library is where you will find the Short-term Forecast Tracker documents in pdf and supporting data in Microsoft Excel format which are included in your subscription.
Click on the Newsletters & reports link in the left-side navigation menu. If you subscribe to Fastmarkets news by default the Newsletters tab will be displayed. Click on Forecasts and Short -term to display the forecast content you have subscribed to.
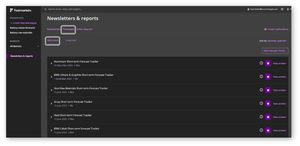
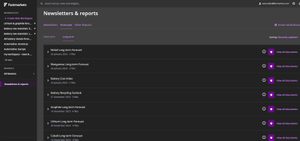
The Reports Library publication page displays:
- the name and date of the publication
- the number of available documents
- Information about the publication – hover your mouse over the information icon (highlighted below)
- Bell icon to enable you to manage your alert preferences (purple denotes you are receiving email alerts for new issues)
- View archive documents link to take you to the latest and archive of the last years publications
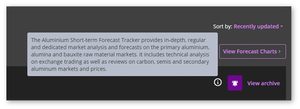
You can view to forecast prices and analysis articles in the Market Pages by clicking on the View Forecast Charts button in the top right corner:
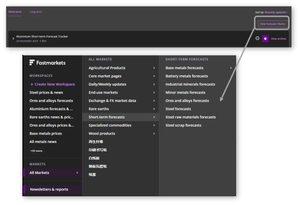
Select the Market Page you would like to view.
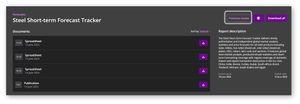
Click on a Tracker publication to expand and view the documents in the latest issue. Click the purple download buttons to download each document.
![]()
Access the one year document archive for Short-term Forecast Trackers
Click on the View archive link for your selected Short-term Forecast Tracker to navigate to the documents page where you can find the latest issue as well as those from the last year. Click on the Previous Issues button to open and select the issue you would like to download. Select the date of the issue you wish to view. This will then display the documents available to download.
Short-term Forecast Tracker email alerts
By default you will be already subscribed to receive email alerts when each new issue is published. This is denoted by the purple bell icon against each issue within your subscription on the publication page and the documents page (see below).
![]()
Should you wish to no longer receive these alerts, click on the purple bell icon. The bell icon will then be coloured grey to denote you are unsubscribed. Click on the icon again if you wish to receive them again, it will return to the purple colour.
When the latest issue is available you will now receive an email alert from Fastmarkets Alert Service – alerts@notify.fastmarkets.com with a link to download the issue from the Fastmarkets Dashboard.
Please ensure you add this address to your safe senders list in your email application to make sure you do not miss out on the next issue.
Your email alert will look like this:
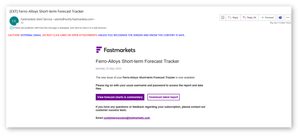
Click the Download latest report button to login to the Dashboard Reports Library to access the latest documents. Click the View forecast charts and commentary button to select a Market Page to view price forecast charts and analysis articles.
For more information on exporting and converting forecast prices please refer to this downloadable User Guide for short-term forecast content in the Dashboard
Long-term forecasts
Fastmarkets’ battery raw materials long-term forecast content is published quarterly and provides prices, forecasts and 10-year outlooks for key battery materials that you can rely on to reflect supply and demand conditions now and for the future.
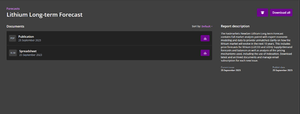
The Dashboard Reports Library is where you can find the latest issue(s) for the Fastmarkets’ battery raw materials long-term forecast publications within your subscription
· View and download one or all documents for the latest issue
· Receive email alerts to your inbox notifying you when the latest issue is available
· Access all content from Fastmarkets in one place; create custom workspaces with prices and/or news alongside your long-term forecast content (please note, this will depend on your Fastmarkets subscription)
Access to the content
Navigate to the Dashboard Reports Library by clicking on the Newsletters & Reports link in the left-hand menu. Depending on your Fastmarkets subscription it will default to either the Newsletters tab for our daily & weekly prices and news curated pdfs or the Forecasts tab. Click on Forecasts and Long-term to view the battery raw materials long-term forecast publications within your subscription in the Reports Tile view. This shows the name and date of the latest publication and the number of published files for the latest issue.
Receive and manage email alerts
By default, you will already be subscribed to receive email alerts when each new issue is published.
Your email alert will look like this. Click the purple Access this issue button to access the issue in the Dashboard Reports Library:
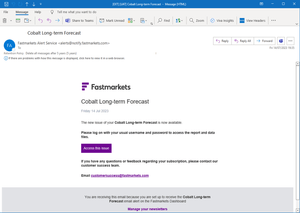
The bell icon denotes you are subscribed to email alerts. You can choose whether to receive them or not by clicking on this icon. Grey denotes unsubscribed, purple subscribed.
![]()
Hover your mouse over the white “i” information icon at the right of each publication to read more about what content is included.
![]()
Download the latest issue
Click on the chevron arrow to the left of the publication to expand and view/download the latest published files. Click on the View all documents link to download all to a zip file or individually. Depending on your browser they may appear in the top right or bottom of your screen. You can also find them in your Windows Explorer downloads folder.
For more information please refer to this downloadable User Guide for long-term forecasts in the Dashboard.
Currency and unit measure conversions
The Dashboard enables you to convert the base currency and/or unit of measure for prices so you can compare them on an apples-to-apples basis. Currency and unit conversion are available in the Single Price Tile, Multi Price Table, Historic Data Table and Price Chart widgets.
How to convert currency and or unit of measure:
- Click on the widget actions menu and select Convert currency/unit
- To convert only the currency of all prices in the widget click into the Convert currency to drop down menu and select your currency e.g. EUR – Euro. Click CONVERT to finish. All prices will now be displayed in Euros.
- To convert only the unit of measure, repeat the above step but select Convert unit to and select the unit of measure e.g. Tonne. Click CONVERT to finish. All prices will now be displayed in Tonnes.
- To convert both currency and unit of measure select from both menus e.g. EUR – Euro and Tonne. Click CONVERT to finish. All prices will now be displayed in Euros per Tonnes.
- Once converted the widget will clearly display your conversion selection in purple in the top right corner of the widget.
- To edit or remove a conversion, click on the purple conversion displayed in the top right of the widget and select either Edit conversion to return to the selection or Remove conversion.
Please note, it is not yet possible to convert the currency and/or unit of measure for exchange prices.
For more information please download a short User Guide.
Customized Newsletters are published in PDF and HTML email formats on a daily and weekly basis based on the Dashboard Market page newsletter options you select.
Customized Newsletters have been designed for customers who wish to receive a digest via email / pdf of prices and/or news depending on their subscription or have previously received the Metal Bulletin or AMM Daily pdf’s.
The newsletters are accessible to you based on your access.
- Newsletters may contain prices and news which will require access to both
- Newsletters based on End-use market pages can include price data and news across several core markets. To subscribe to these newsletters, you will need access to all prices and at least one news service.
- Newsletters that contain news will require access to at least one news service
- If your level of access provides news only you will only be able to subscribe and view newsletters containing news
- If your level of access provides only prices you will only be able to subscribe and view newsletters containing prices
How to access newsletters?
There are two ways to access newsletters settings in the Dashboard
Newsletter Center
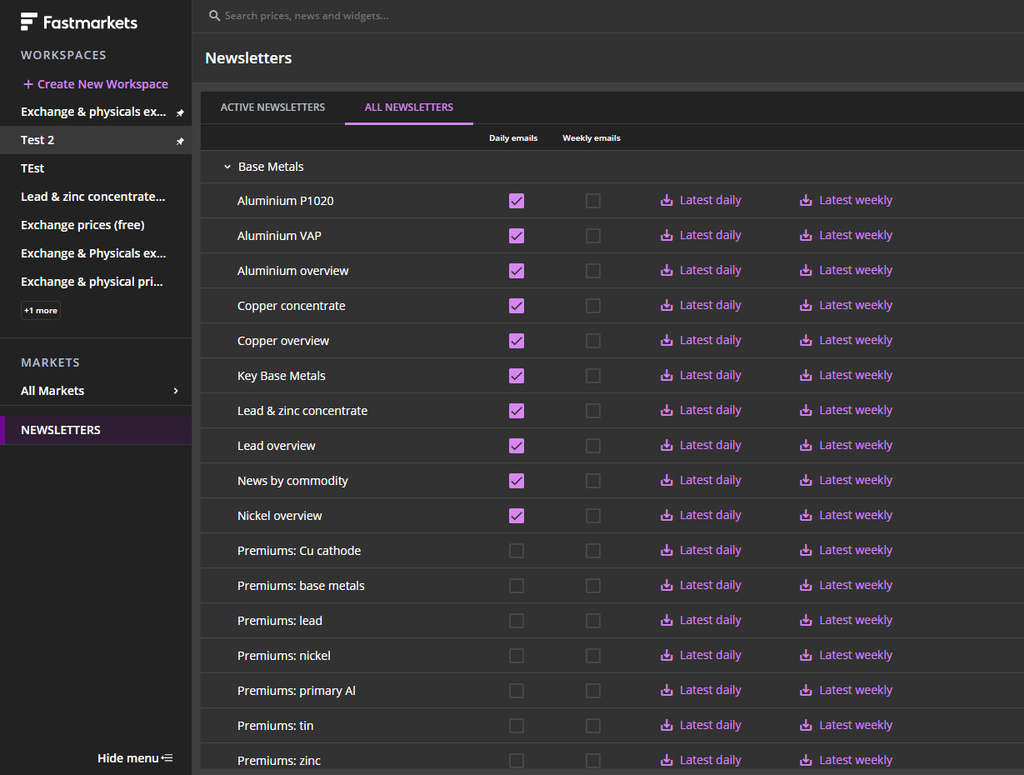
- Click on the Newsletters button in the left sidebar will open the Newsletters area within the dashboard.
- This table has two tabs displayed at the top. Clicking on the ALL NEWSLETTERS tab shows all available newsletters.
- Clicking on a group (e.g. Core market pages) will display all relevant newsletters within that group.
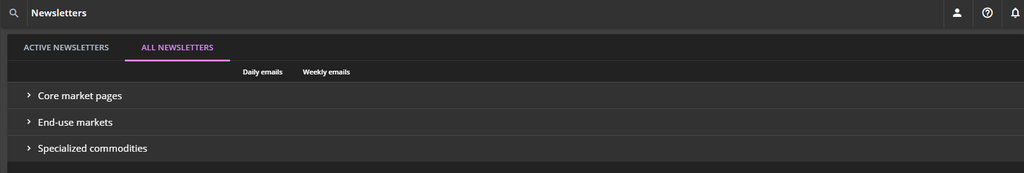
- Each row (e.g. Base metals prices & news) represents a customized newsletter.
- Click on ‘Latest daily” to download the latest daily newsletter or ‘Latest weekly’ to download the latest weekly newsletter for that price category
Market pages
Newsletters can also be accessed from the market page directly once you have opened the page from the All Markets menu on the left sidebar.
- Clicking on the Newsletter button at the top right hand corner
- Click on the Latest daily or Latest weekly options in the drop down menu to download the latest newsletter for this market page.
How to set up newsletters to be delivered via email?If you want to receive newsletters via email, you can set this up through the dashboard.
- Click on the Newsletters button in the left sidebar will open the Newsletters area within the dashboard.
- This table has two tabs displayed at the top. Clicking on the ALL NEWSLETTERS tab shows all available newsletters.
- Clicking on a group (e.g. Core market pages) will display all relevant newsletters within that group.
- Each row (e.g. Base metals prices & news) represents a customized newsletter.
- Tick the ‘Daily emails’ or ‘Weekly emails’ boxes next to the relevant newsletter that you want to receive.
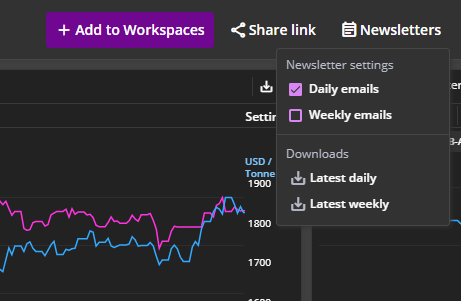
Alternatively you can set up newsletters in a market page:
- Navigate to the market page you want to receive newsletters about
- Select the Newsletter button
- Tick the Daily emails or Weekly emails boxes in the dropdown.
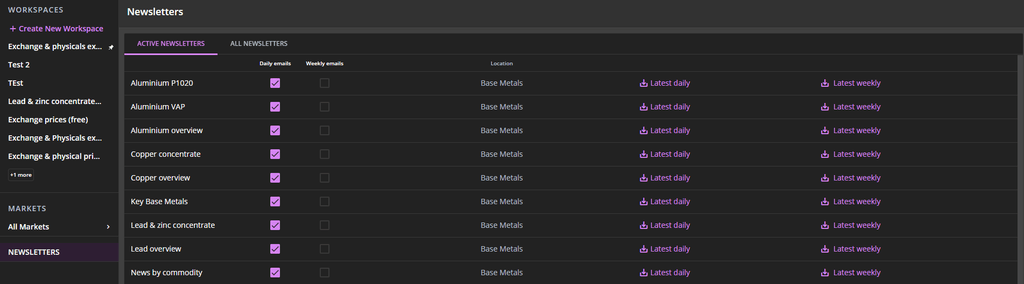
Review and change your newsletter options If you want to review what newsletters you have selected, you can do this in the Newsletter Center.
- Click Newsletters in the left sidebar to open the Newsletters Center
- Select the ACTIVE NEWSLETTERS tab to view all of the newsletters you are receiving
- If you no longer want to receive a newsletter, you can un-tick the box next to it.
Access the newsletter archive
You can access past issues of any Daily or Weekly newsletter you have missed directly in the Dashboard
- Click Newsletters in the left sidebar to open the Newsletters Center
- Select the ACTIVE NEWSLETTERS tab to view all of the newsletters you are receiving
- Click Past Issues to the right of each newsletter and select either by scrolling back and selecting the Daily or Weekly for your chosen date or click on the Jump to date link at the top to open the calendar and select a month/year.
- To browse past issues for all newsletters click ALL NEWSLETTERS and repeat step 3 above.
- Alternatively past issues can be accessed from individual Market Pages from the Newsletter menu in the top right corner, selecting Browse past issues.
Please note newsletters are available from 6th October 2020 when this feature was added to the Dashboard.
What does the newsletter email notification contain?The newsletter email notification will contain the headline and a summary of the articles plus the pricing tables containing the latest actual assessments and monthly averages in that newsletter. When you click on a headline, it will open the full article in the dashboard. When you click on a symbol within a price table, it will open the price details in the dashboard.
Within the email you will find an ‘Open PDF newsletter’ button which allows you to download the PDF version of the newsletter. Please note you have to be a logged-in Fastmarkets dashboard user to be able to download PDF newsletters. How are Daily and Weekly PDF newsletters constructed?
The newsletter follows the structure and the content of the market page. If you would like to visit the market page which the newsletter is based on, you can access it through the link at the top of the newsletter.
The first section of the newsletter is called ‘Top stories’. This section highlights the most important daily news articles selected by the Fastmarkets Editorial team.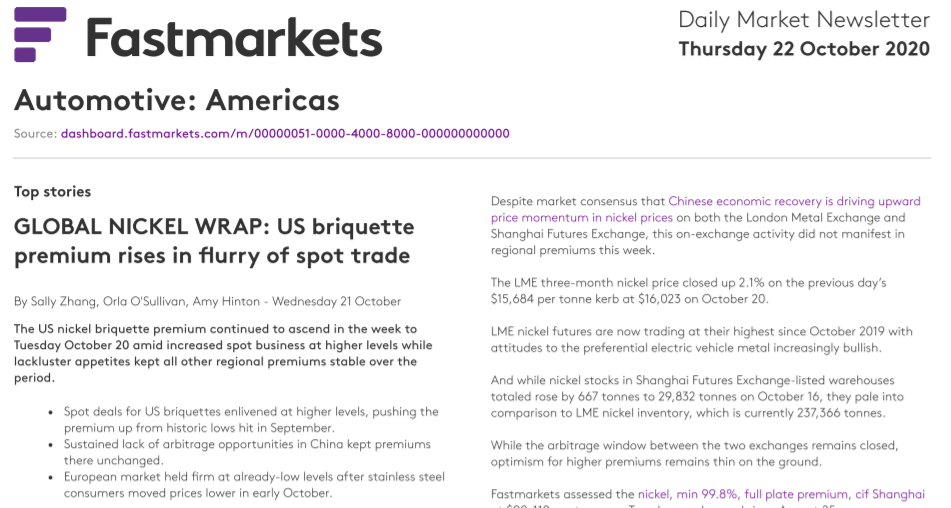
Below the Top stories section, you will be able to see news articles and price tables. These are direct representations of the News list and Multi price table widgets in the market page. In the example below, the news section called ‘Steel news’ corresponds to the ‘Steel news’ widget in the market page.
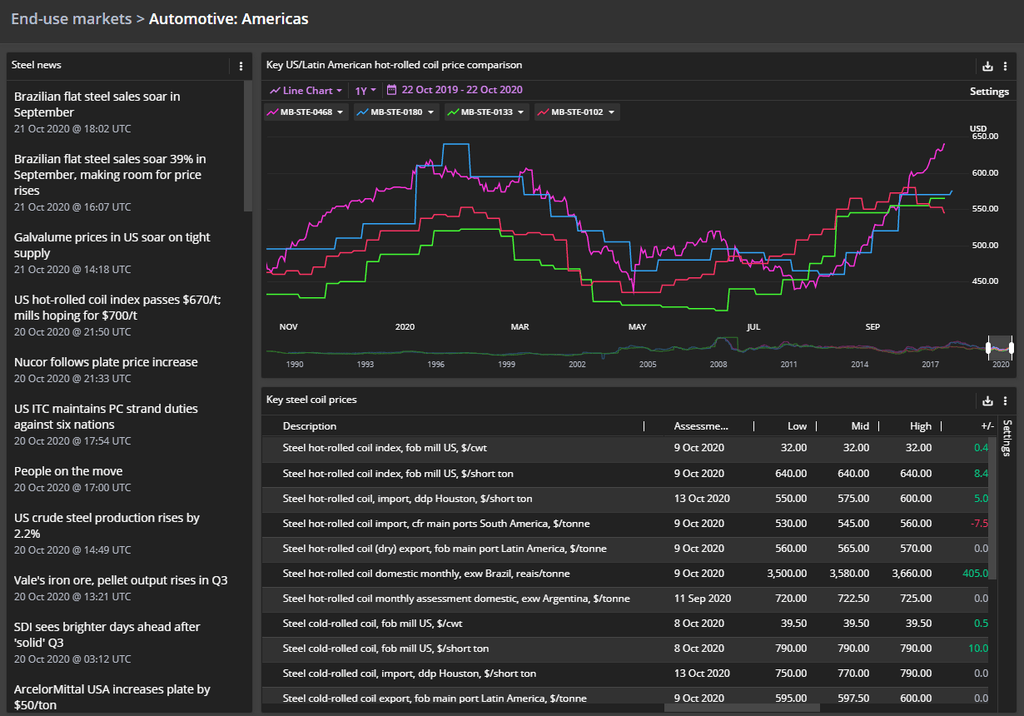
Similarly, the ‘Key steel coil prices’ section of the newsletter corresponds to the ‘Key steel coil prices’ widget in the market page. Please note that price tables in the newsletter have fixed fields and these fields may differ to what is displayed in the market page. These fields inlcude the latest actual assessments and monthly average prices.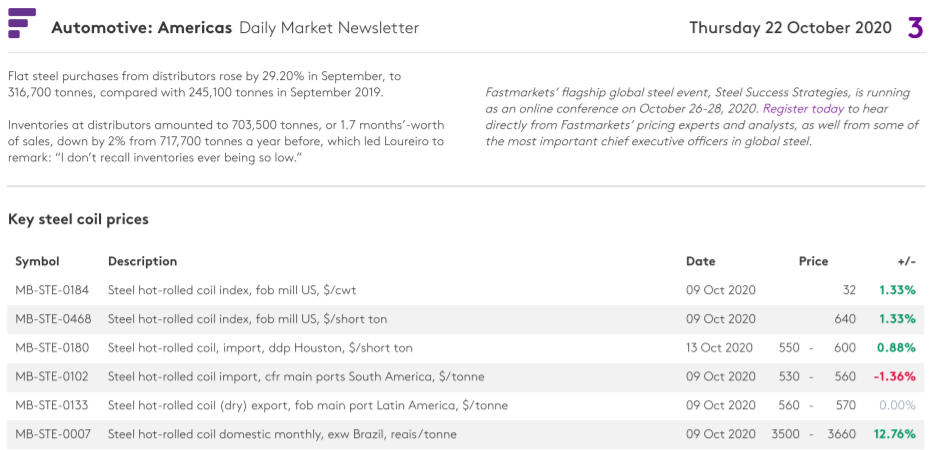

For more information please download a short User Guide.
Assessing historical prices is critical for understanding market trends, assessing volatility, and creating forecasts. View historical series for multiple prices in the Fastmarkets Dashboard either directly from the Price Chart widget (view up to eight prices) or in the Historic Price Table widget (view up to 20 prices).
To add the Historic Price Table widget, click Add Widgets > Historic Price Table, then search for and add prices.
Click Add to add the Historic Price Table widget to your workspace.
- By default, the Mid price is displayed.
- Assessed prices are displayed in bold white.
- Prices in gray are the assessed prices repeated across each working date up to the current date.
Click on the “Widget actions” menu and select “Edit widget” to add prices or click Settings to add more fields. The Historic Price Table widget will adjust the layout to maximize the pricing displayed.
You can re-order the prices added to the table if by hovering your mouse over the symbol, when the hand icon appears, then click and drag to the desired position.
Edit the date range in the Historic Price Table widget
By default, the Historic Price Table widget displays one year of prices.
This can be edited by selecting from pre-defined ranges in the dropdown menu, or by selecting a start and end date in the calendar picker.
View historical prices in a data table from the Price Chart widget
You can view historical prices in a data table from your Price Chart widget without navigating to a different widget or workspace. Click on the Line Chart menu above the legend to change the view to Data Table.
To return to the chart display, click Data Table in the top-left corner of the widget, then click Line Chart.
Our Customer Success team is here to help. Contact them today on:
Email: customersuccess@fastmarkets.com
Telephone: EMEA +44 (0)20 3855 5581 | Asia +65 3163 3458 | Americas +1 708 329 2641